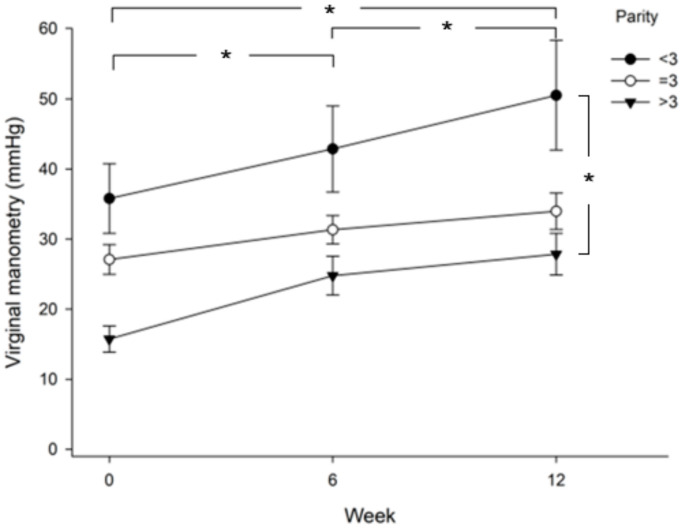
Figure 3.
Comparison of vaginal pressure between groups of parity >3, =3, or <3. Significant differences are shown between the three groups at week 6 vs. baseline (p = 0.000), week 12 vs. baseline (p = 0.000), and week 12 vs. week 6 (p = 0.002). Vaginal pressure in the parity >3 group is significantly lower than that in the parity <3 group (least significant difference test, p = 0.003); *, p < 0.05.

