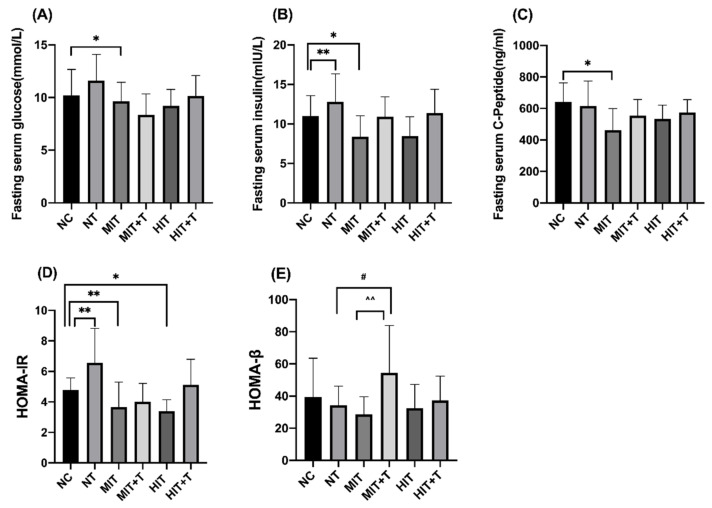
Figure 3.
Changes of fasting serum glucose (A), insulin (B), C-peptide (C), the index of the homeostasis model assessment of insulin resistance (HOMA-IR, D) and islet β-cell secretion (HOMA-β, E) of six groups. Statistics are means ± SD. *, p < 0.05 vs. the NC group; **, p < 0.01 vs. the NC group; #, p < 0.05 vs. the NT group; ^^, p < 0.01 vs. the MIT group. NC, non-exercise group; NT, none-exercise toxic group; MIT: moderate-intensity exercise group; MIT+T, moderate-intensity exercise toxic group; HIT, high-intensity exercise group; HIT+T, high-intensity exercise toxic group.

