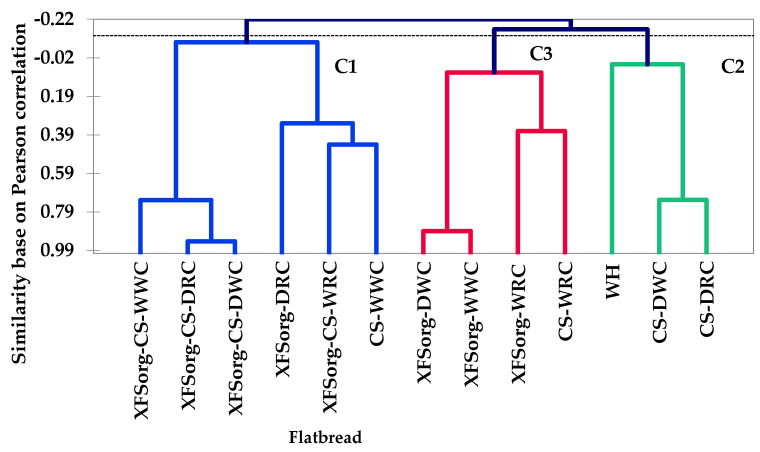
Figure 5.
Agglomerative hierarchical clustering (AHC) dendrogram of flatbread models made from composite flours and control by unweighted pair-group average method using the first six factor scores from PCA. The dash line shows position where flatbreads were partitioned into three groups and distinguished by colours. For names of flatbreads, please refer to Table 1.

