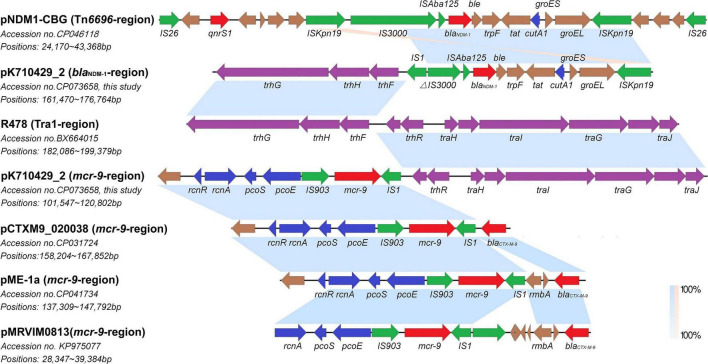
FIGURE 2.
Co-linear analyses for the genetic environment of blaNDM–1 and mcr-9 in plasmid pK710429_2. The blaNDM–1-harboring-region in plasmid pK710429_2 was compared with TN6696-region in plasmid pNDM1-CBG and Tra1-region in plasmid R478; the mcr-9-harboring-region in plasmid pK710429_2 was compared with Tra1-region in plasmid R478, mcr-9-harboring-region in plasmid pCTXM9_020038, pME-1a, and pMRVIM0813. Blue or orange shading denotes regions of shared homology or inversion among different plasmids, respectively. Colored arrows indicate open reading frames, with red, green, blue, purple, and brown arrows representing antimicrobial resistance genes, mobile elements, heavy metal resistance genes, conjugative transfer genes, and plasmid backbone genes, respectively. Δ indicates the truncated gene.

