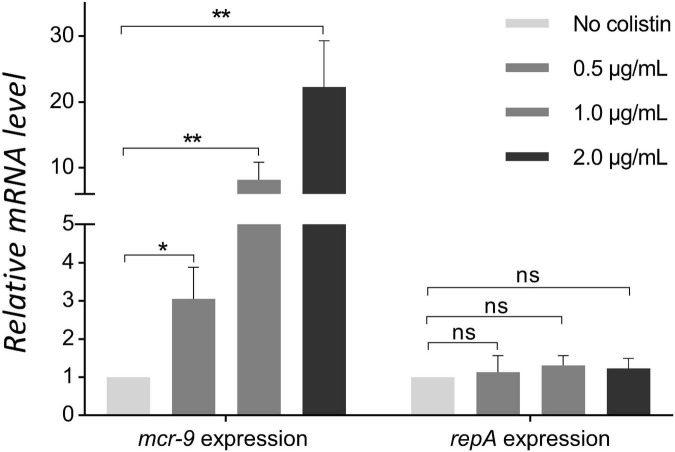
FIGURE 3.
Comparison of mcr-9 and repA expression levels in strain KPN710429 with and without colistin pretreatment. Error bars indicate the standard deviation for three triplicate samples. Asterisks indicate statistical significance at different levels by Student’s t-tests. *P < 0.05; **P < 0.01; ns, not significant.

