
. 2021 Dec 8;5(12):e28040. doi: 10.2196/28040
©I-I Lin, You-Lin Chen, Li-Ling Chuang. Originally published in JMIR Formative Research (https://formative.jmir.org), 08.12.2021.
This is an open-access article distributed under the terms of the Creative Commons Attribution License (https://creativecommons.org/licenses/by/4.0/), which permits unrestricted use, distribution, and reproduction in any medium, provided the original work, first published in JMIR Formative Research, is properly cited. The complete bibliographic information, a link to the original publication on https://formative.jmir.org, as well as this copyright and license information must be included.
Figure 9.
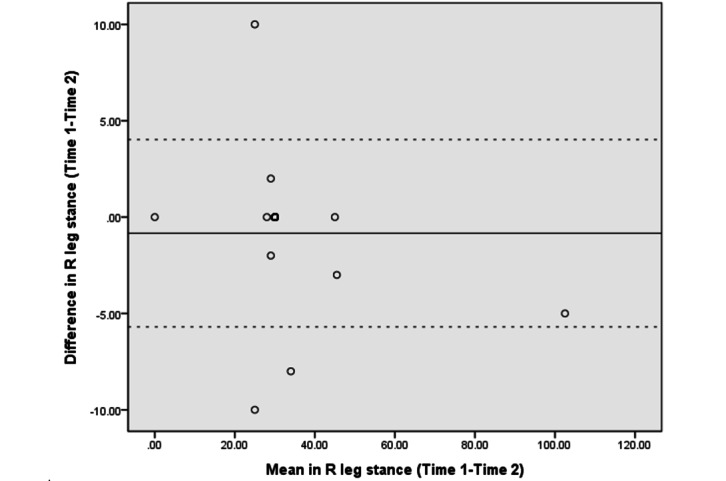
The Bland–Altman plots of differences between the 2 measurements in right leg stance tests. R: right.