Figure 3.
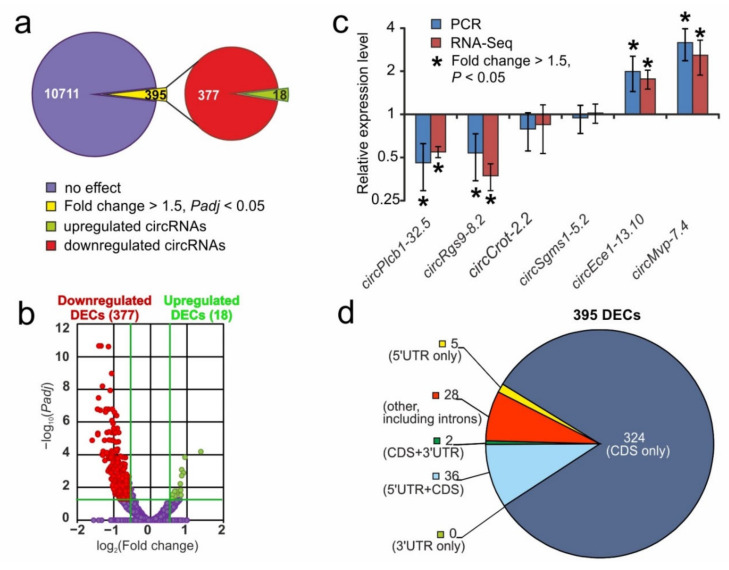
RNA-Seq analysis of DECs at 24 h after tMCAO. (a) RNA-Seq results in IR24 versus SH24. The numbers in the diagram sectors indicate the number of DECs. (b) A volcano plot shows the distributions of genes between the IS24 and IR24 groups. Up- and downregulated DECs are represented as red and green dots, respectively (fold change > 1.50. Padj < 0.05). Not differentially expressed circRNAs (non-DECs) are represented as dark purple dots (fold change ≤ 1.50. Padj ≥ 0.05). (c) RT-PCR verification of the RNA-Seq results. Data for comparison in IR24 versus SH24 are shown. Two reference mRNAs for Gapdh and Rpl3 were used to normalize the PCR results. In each group, there were at least 5 rats. Four circRNAs that change the expression more than 1.5-fold from the baseline value and whose p-value was lower 0.05, as well as two other circRNAs, were selected for analysis. (d) Annotations of genomic regions mapping to DECs. Numbers in sectors indicate the number of DECs contained corresponding to structural elements of genome.

