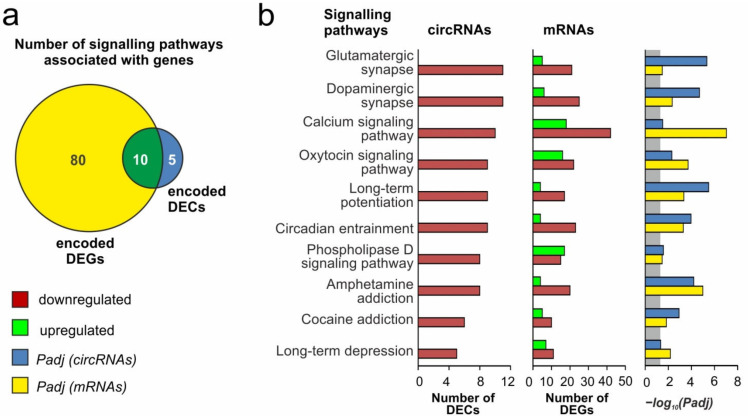
Figure 5.
Analysis of the signaling pathways associated with DECs at 24 h after tMCAO. A pathway enrichment analysis of DEGs in pairwise comparisons IR24 vs. SH24 was carried out according to the gProfileR. (a) Schematic comparison of the signaling pathways associated with genes that encoded DECs and genes that encoded DEGs obtained in pairwise comparison IR24 vs. SH24 by Venn diagram. The numbers in the diagram segments indicate the number of genes. (b) The characteristics of the 10 signaling pathways that lie within the intersection on the Venn diagram (a). The number of upregulated and downregulated RNAs, as well as the Padj-values, are shown. Only those RNAs and signaling pathways whose Padj < 0.05 were selected for analysis. Padj ≥ 0.05 are enclosed in the gray background.

