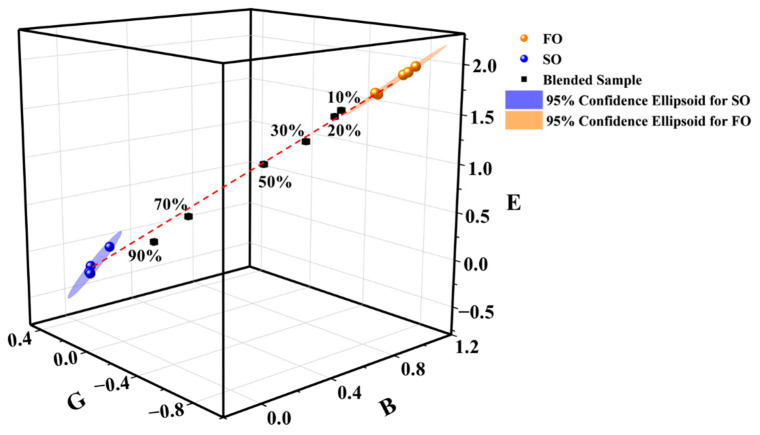
Figure 6.
Signal intensities of the B, E, and G regions of the heat map plots in Figure 5 within the 3D characteristic coordinate system with the 95% confidence ellipsoids corresponding to the FO and SO clusters. The red dash line is connected by the center points of the two confidence ellipsoids.

