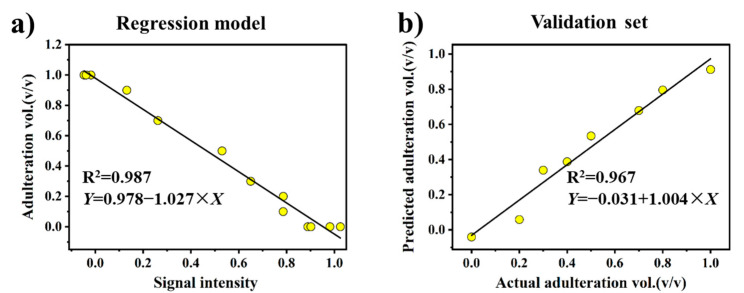
Figure 7.
(a) The univariate regression model for the signal intensities of FO, SO, and mixed FO-SO samples in region B of the corresponding heat map plots as a function of the adulteration ratio. (b) The plot of actual adulteration ratio values versus the values predicted by the univariate regression model.

