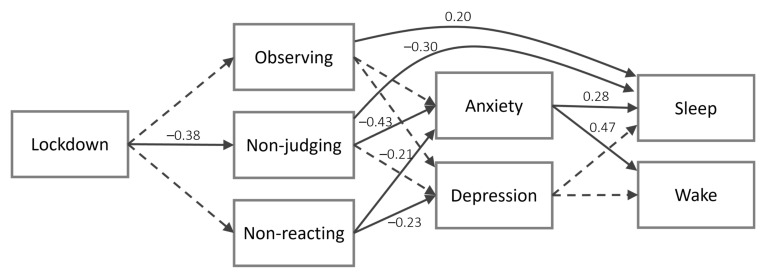
Figure 2.
Second model including all the subscale scores. Continuous arrows represent significant paths, while dotted arrows represent non-significant paths. Standardized coefficients are reported only for significant paths. For the sake of clarity, only the direct paths from lower levels to higher levels that were significant are shown: e.g., the paths from lockdown to distress and sleep variables are not shown because they were not significant.

