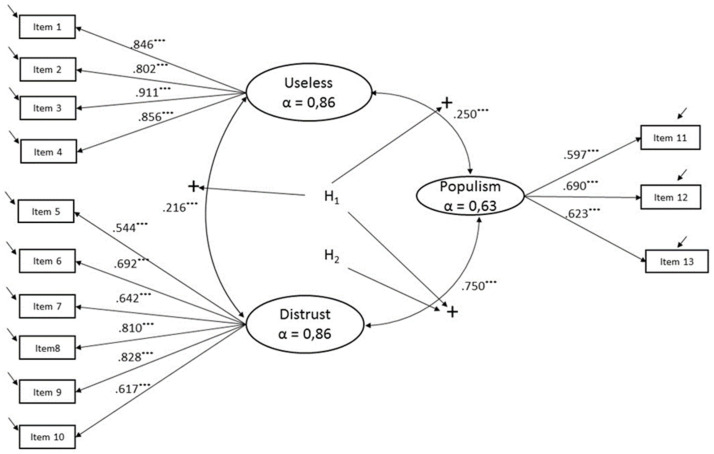
Figure 2.
Measurement Model. The latent variables proposed in the model (circled) and the signs hypothesized in their relationships are depicted in the center of the figure. Each latent variable has its associated Conbrach’s alpha (α). All of the path loads from latent variables to items are in standardized terms. *** represents p-values significant at the 1% level of significance.

