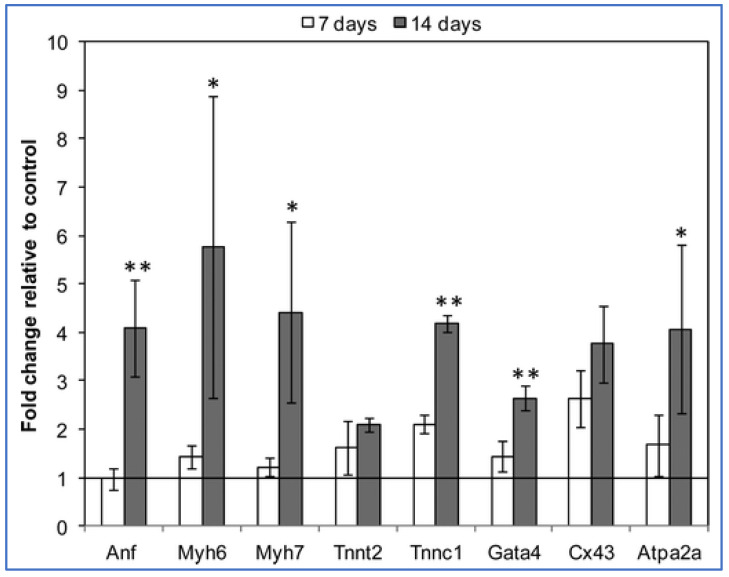
Figure 5.
Gene expression data of cardiomyocytes cultured on chitosan/carbon scaffolds for 7 days and 14 days vs. control samples (chitosan scaffolds cultured using the same conditions) [33]. The fold change in gene expression is relative to the control (chitosan/carbon/cell constructs vs. chitosan/cell constructs). * p < 0.01; ** p < 0.05. (Anf = atrial natriuretic factor, Myh6/Myh7 = myosin heavy chain, Tnnc1 = troponin C type 1, Cx43 = gap junction α-1 or connexin 43, Atpa2a2 = calcium transporting ATPase).

