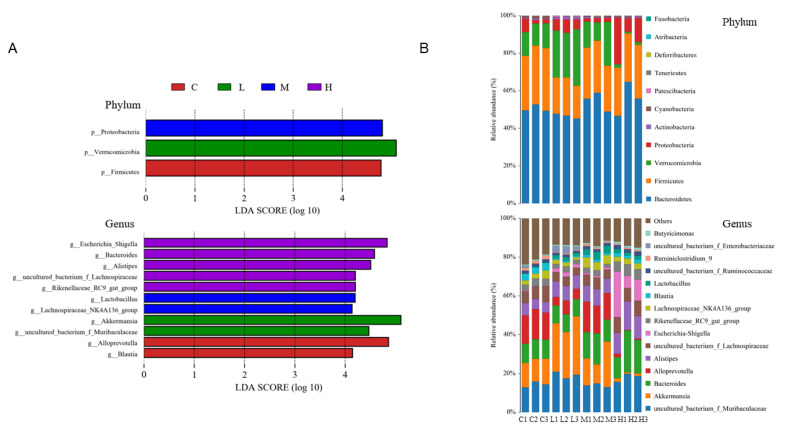
Figure 4.
The dominant composition of gut microbiota after FRJ treatments. (A) Linear discriminant analysis (LDA) effect size (LEfSe) analyses at phylum and genus level (LDA score > 4.0). (B) Relative abundance of microbiota at phylum and genus level. C: mice fed with standard diet; L: mice fed with 3% (wt:wt) FRJ supplementation; M: mice fed with 6% (wt:wt) FRJ supplementation; H: mice fed with 9% (wt:wt) FRJ supplementation. Each number of the samples represents one replicate.

