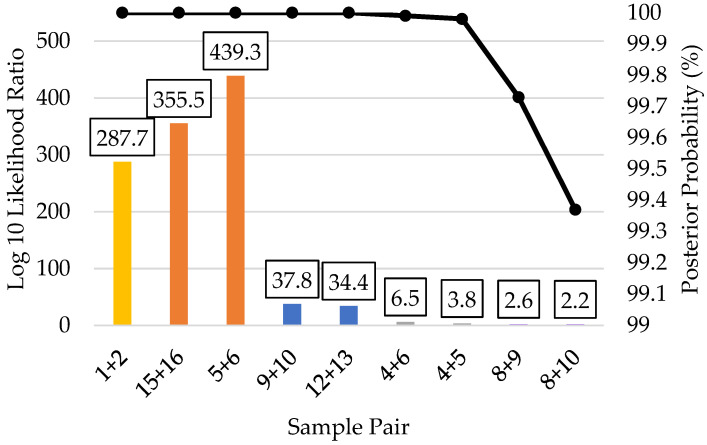
Figure 7.
Pairwise kinship prediction log 10 likelihood ratio (LR) (left y-axis; bars) and posterior probabilities (right y-axis; black line) of reference-to-reference comparisons. All predictions compared the expected (known) relationships vs. unrelated. Parent/offspring = yellow (sample pair 1 + 2); full siblings = orange (sample pairs 15 + 16 and 5 + 6); third degree = blue (sample pairs 9 + 10 and 12 + 13); fifth degree = gray (sample pairs 4 + 6 and 4 + 5); and sixth degree = purple (sample pairs 8 + 9 and 8 + 10).

