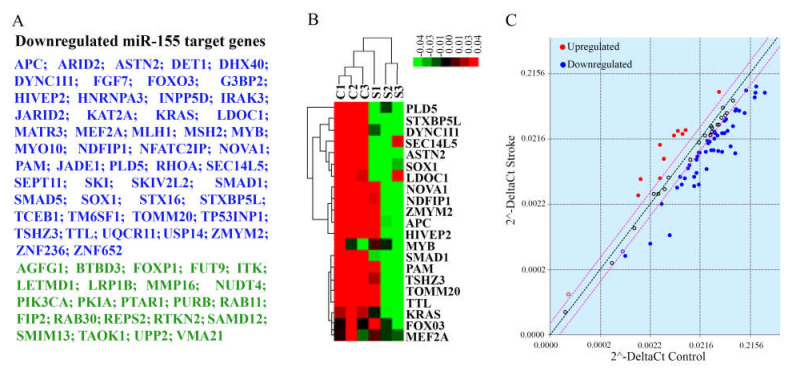
Figure 6.
miR-155 target gene analysis. (A) A list of miR-155 direct target genes significantly downregulated in stroke tissue, compared to control samples. Blue—genes identified by PCR Array, green—additional genes identified by whole transcriptome sequencing. (B) A portion of a heatmap (after non-hierarchical clustering) displays a group of target genes with significantly lower (green) expression in the stroke samples. The heat map was generated based on delta Ct values. Genes with higher expression levels are shown in red, whereas genes with lower expression levels are shown in green. Genes with average expression levels are shown in black. (C) Scatter plot compares the normalized gene expression between the stroke and control samples. The central line indicates unchanged gene expression. Red circles identify genes significantly upregulated in stroke tissue, blue—genes significantly downregulated in stroke group. The graph plots the log10 of normalized gene expression levels in control samples (x-axis) versus stroke samples (y-axis). N = 3 samples per control and stroke groups.

