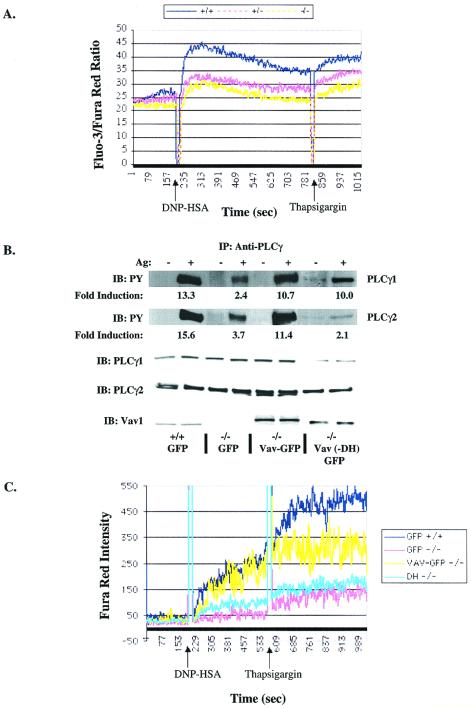
FIG. 7.
Calcium mobilization and tyrosine phosphorylation of PLCγ1 and PLCγ2 are Vav1 dependent. (A) IgE-sensitized Vav1+/+ (blue), Vav+/− (red), and Vav−/− (yellow) cells (2 × 10⁶) in Tyrodes–0.05% BSA were loaded with Fluo-3-AM and Fura Red AM for determination of calcium mobilization by flow cytometry. Cells were stimulated with 30 ng of Ag followed by 1 μM thapsigargin (as indicated). Data shown are ratios of Fluo-3 and Fura Red dye fluorescence measured over time. One representative of four experiments is shown. (B and C) For reconstitution of PLCγ phosphorylation (B) and the calcium response (C), cells were infected with a GFP-expressing viral vector or one containing Vav1-GFP and loaded with Fura Red AM only (C). (B) Lysates were prepared from Vav1+/+ BMMCs expressing GFP (GFP; lanes 1 and 2), Vav1−/− BMMCs expressing GFP (GFP; lanes 3 and 4), Vav1−/− BMMCs expressing Vav1-GFP (lanes 5 and 6), or Vav1−/− BMMCs expressing Vav1-GFP with the Dbl domain deleted (−DH) (lanes 7 and 8) following 0 or 2 min of stimulation with 100 ng of Ag. PLCγ1 and PLCγ2 were immunoprecipitated, resolved by sodium dodecyl sulfate-polyacrylamide gel electrophoresis, and transferred to nitrocellulose membranes. Tyrosine phosphorylation (PY) was determined by blotting with the antiphosphotyrosine Ab (upper panels). Individual protein levels were determined by reblotting with protein-specific Abs (lower panels). One representative experiment is shown. The fold induction was determined by densitometric analysis of a minimum of three experiments, and the intensity of the phosphotyrosine signal was normalized to the amount of immunoprecipitated protein. Standard deviations ranged from 7 to 22% of the values shown. IP, immunoprecipitation; IB, immunoblotting. (C) Infected BMMCs were identified by GFP fluorescence. The calcium response of Vav1+/+ cells expressing GFP (blue), Vav1−/− cells expressing GFP (pink), Vav1−/− cells expressing −DH Vav1-GFP (teal), or Vav1−/− cells expressing Vav1-GFP (yellow) was assessed following stimulation as described above. Data are presented as Fura Red intensities for GFP+ cells over time.

