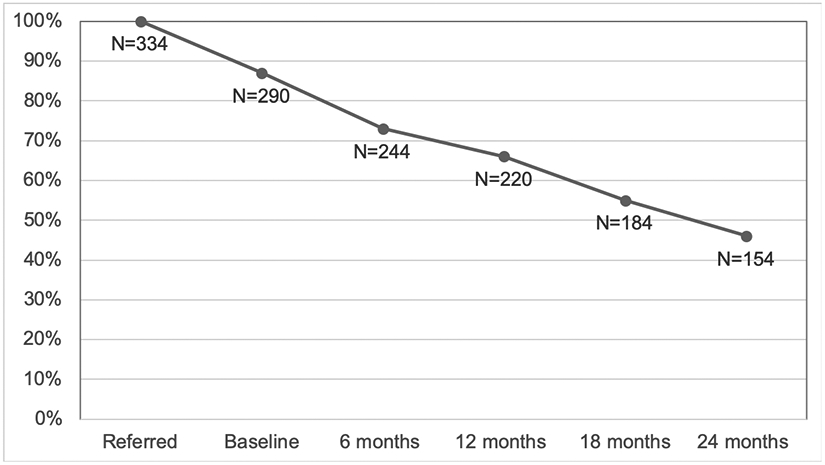
Figure 1. Time in Applied Behavior Analysis over 24 Months.

This figure shows the percentage of the sample (N= 334 children referred for Applied Behavior Analysis [ABA] in 2016 or later) retained in ABA at 6-month intervals over the course of the 24-month study. By 24 months, 46% of the sample (N=154) remained in services.
