
Figure 4. DR1 CAR T cells suppress CD4+ T cell responses in vivo.
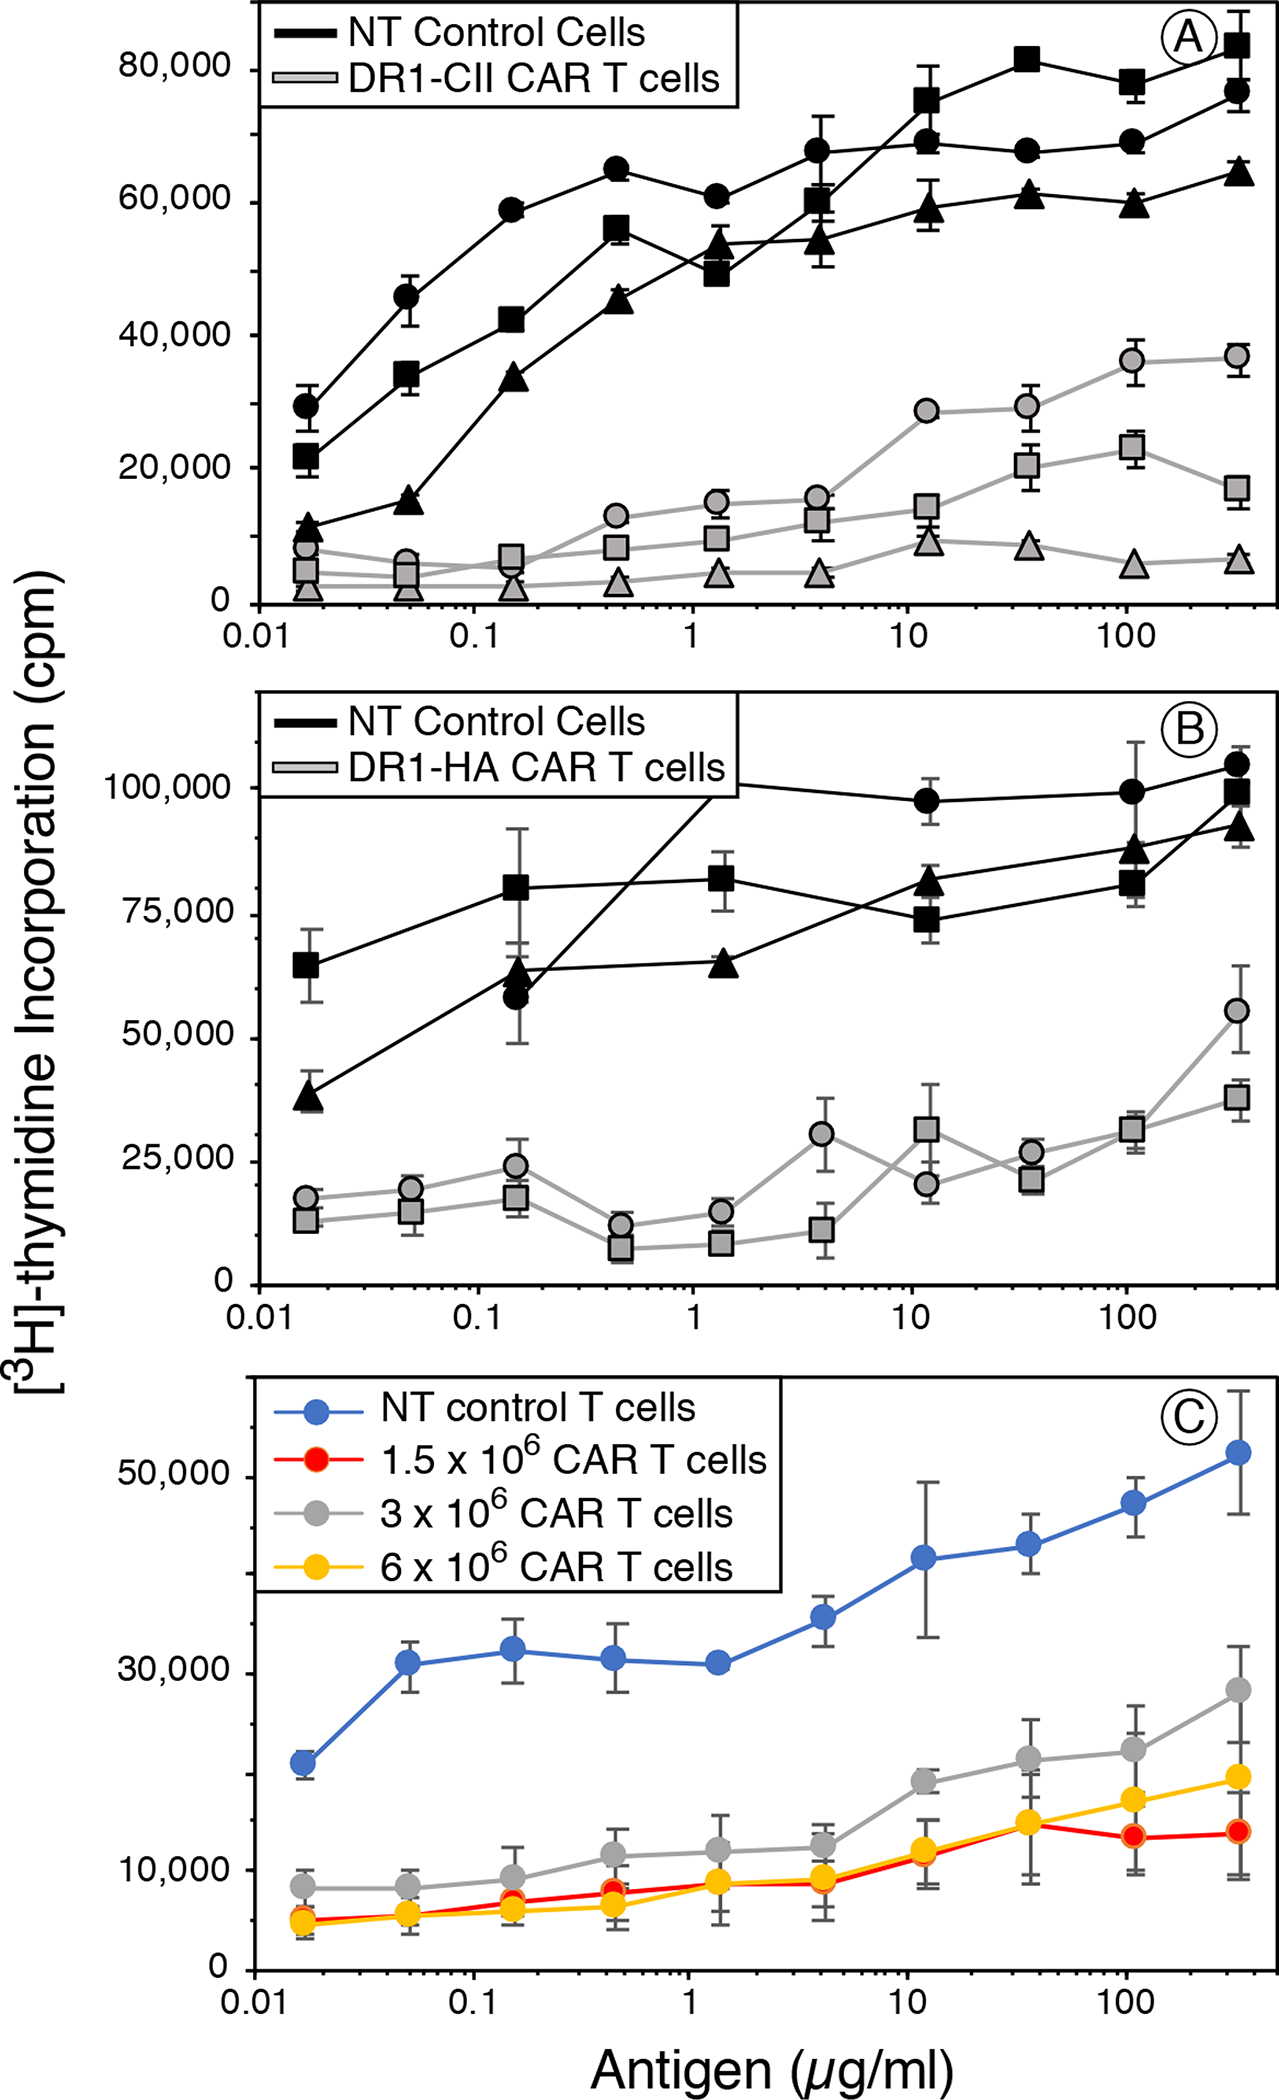
B6.DR1 mice were immunized with CII/CFA or HA/CFA, and on days 4 and 7 mice were treated with 2 × 10⁶ DR1-CII or DR1-HA CAR T-cells or non-transduced CD8+ T cells as the negative control. Four days after the last treatment, draining lymph node cells were collected, and tested for their ability to be re-stimulated in vitro with various concentrations of CII or HA peptide in a T cell proliferation assay. A. Mice immunized with CII/CFA and treated with DR1-CII CAR T cells. Mice receiving the NT control CD8+ T cells developed a strong T cell proliferative response when re-stimulated with the CII peptide (black lines, 3 individual mice). In comparison, mice treated with the DR1-CII CAR T-cells had significantly reduced proliferative responses (grey lines, 3 different mice, p < 0.03 for 11 highest antigen concentrations in comparison to the NT control cells). B. Mice immunized with HA/CFA and treated with DR1-HA CAR T cells. Similar to panel A, HA - immunized mice treated with DR1-HA CAR T cells (grey lines) had a significantly reduced T cell response to HA in comparison to NT controls (black lines, p < 0.004 for 8 highest antigen concentrations in comparison to the NT control cells). C. Dose effect of CAR T cells on the suppression of the T cell response. Mice were immunized with CII/CFA and treated with various numbers of CAR T cells on days 5 and 10. On day 12 draining lymph node cells were collected, and tested for their ability to be re-stimulated with CII peptide in vitro. While the T cell response was suppressed in mice receiving all 3 dose of CAR T cells (p < 0.05 for each dose in comparison to NT control cells), no significant differences were observed among the 1.5 × 10⁶, 3 × 10⁶, and 6 × 10⁶ CAR T cell doses. Data from these experiments are representative of 2 or 3 experiments each. Each experiment was repeated a minimum of 2 times, and data are based on quadruplicate repeats for each point. Errors bars indicate standard error of the means.