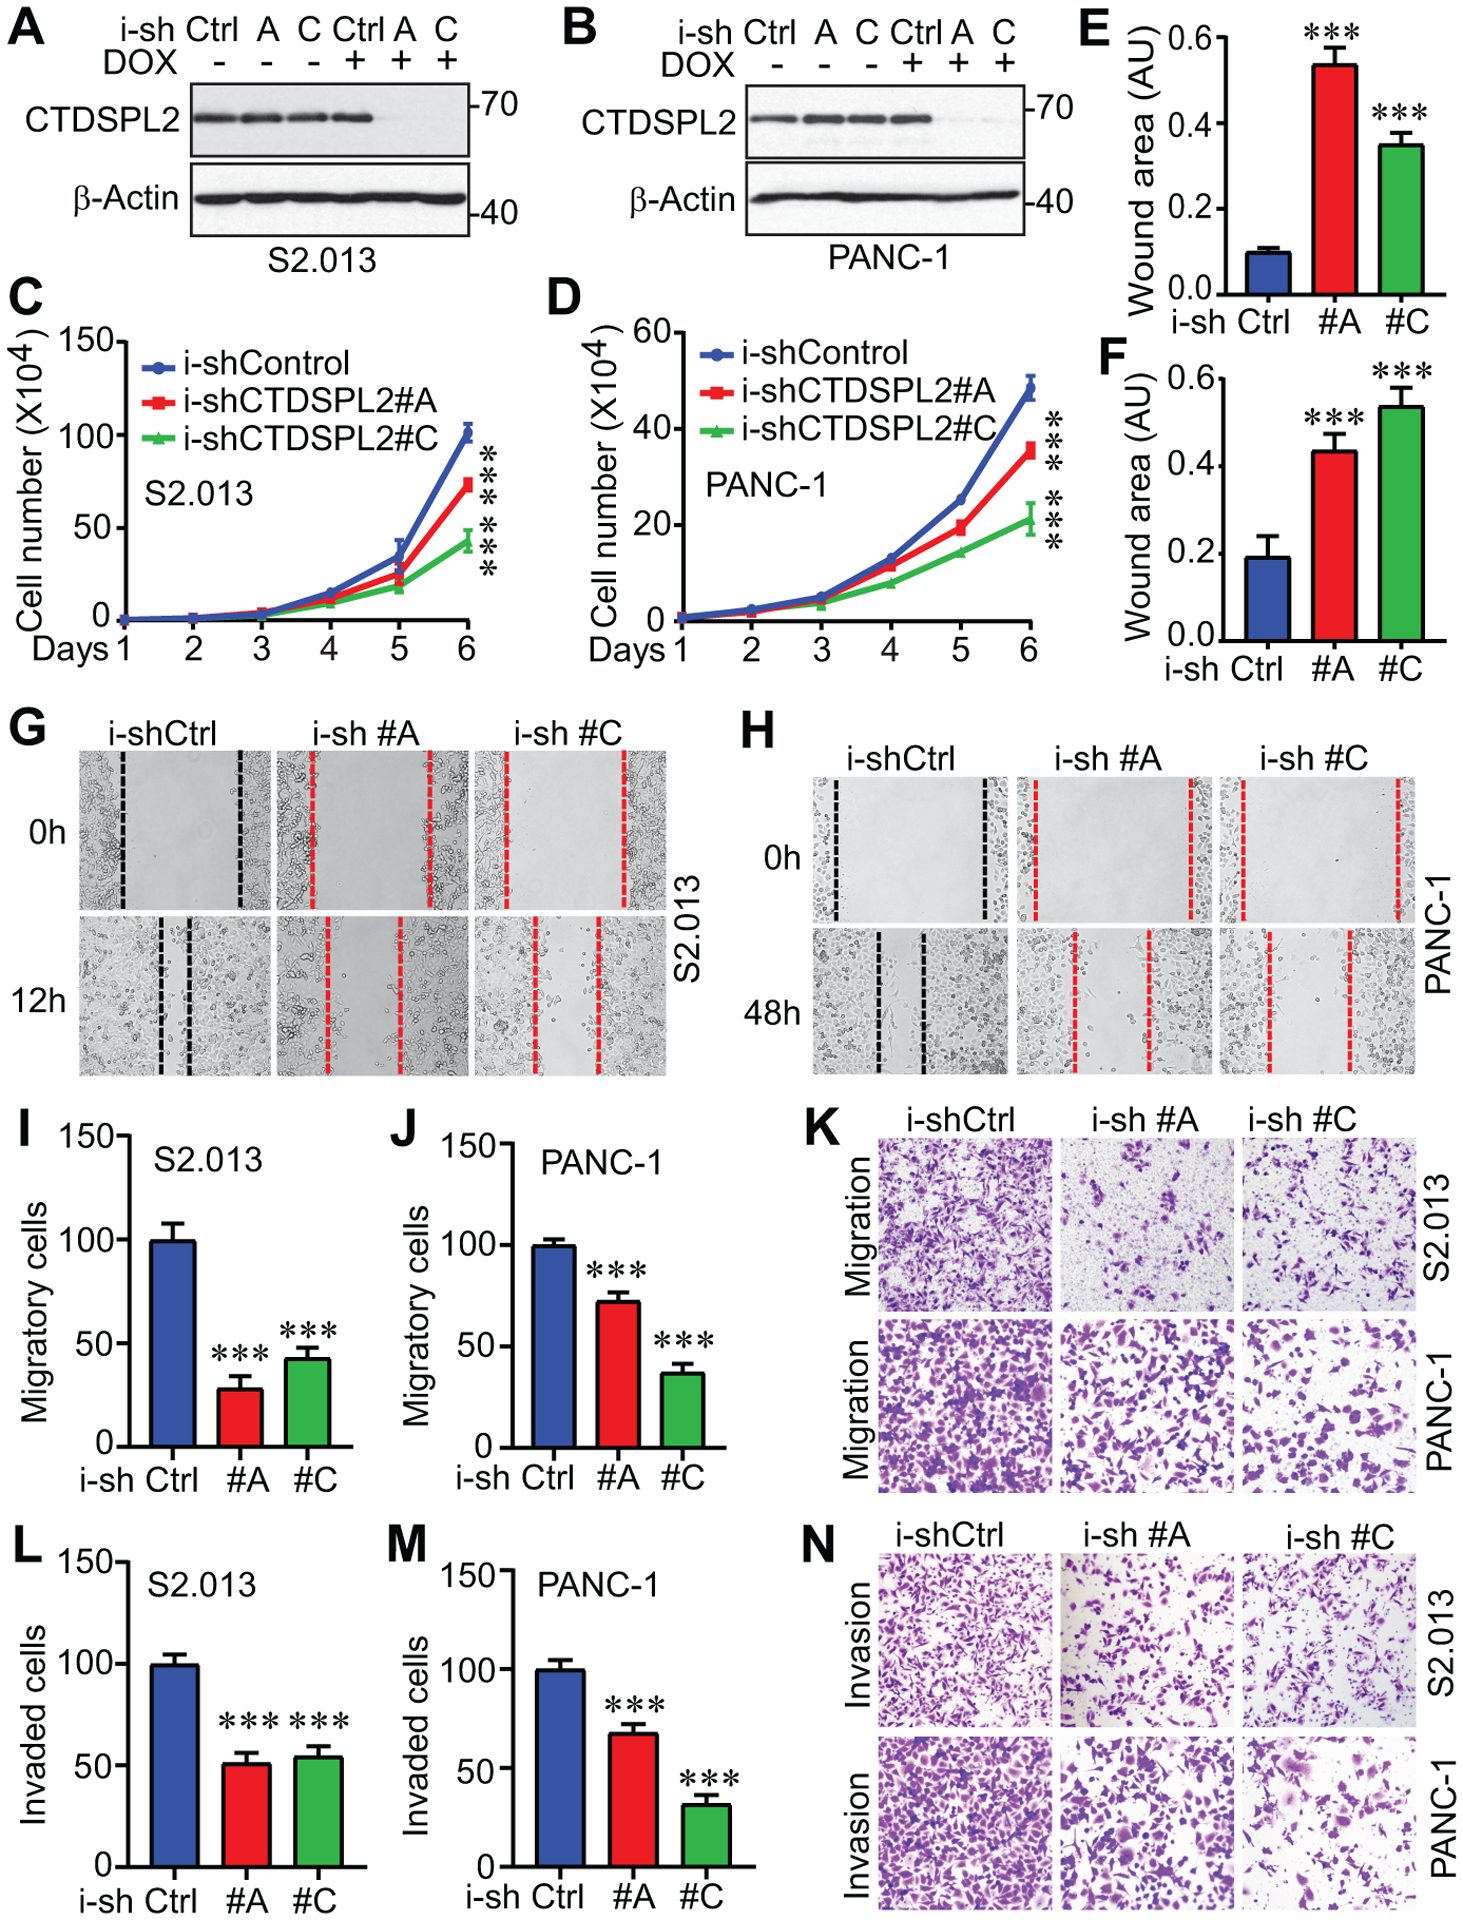
Fig. 4. CTDSPL2 knockdown leads to impaired cell proliferation, migration, and invasion.

(A, B) Establishment of cell lines with TetOn inducible knockdown of CTDSPL2 in S2.013 (A) and PANC-1 (B) cells. (C, D) Cell proliferation assays in S2.013 (C) and PANC-1 (D) cells from A and B. ***: p=0.0002 (shRNA#A vs Control) and 7.3E-06 (shRNA#C vs Control) in panel C. ***: p=0.0003 (shRNA#A vs Control) and 2.1E-05 (shRNA#C vs Control) in panel D (Student’s t test). (E-H) Quantification of wound healing assays in established S2.013 (E) and PANC-1 (F) cells. ***: p=4.8E-05 (shRNA#A vs Control) and 9.0E-05 (shRNA#C vs Control) in panel E. ***: p=1.8E-04 (shRNA#A vs Control) and 3.2E-05 (shRNA#C vs Control) in panel F (Student’s t test). Representative images of wound healing assays in S2.013 (G) and PANC-1 (H) cells were shown. (I-N) CTDSPL2 knockdown inhibited migration and invasion in S2.013 (I, K, L) and PANC-1 (J, M, N) cells. ***: p=1.2E-05 (shRNA#A vs Control) and 6.4E-05 (shRNA#C vs Control) in panel I. ***: p=6.1E-05 (shRNA#A vs Control) and 1.1E-06 (shRNA#C vs Control) in panel J. ***: p=0.0003 (shRNA#A vs Control) and 0.0005 (shRNA#C vs Control) in panel L. ***: p=5.0E-05 (shRNA#A vs Control) and 6.6E-07 (shRNA#C vs Control) in panel M (Student’s t test). Data were expressed as the mean ± SD of three or four independent experiments.
