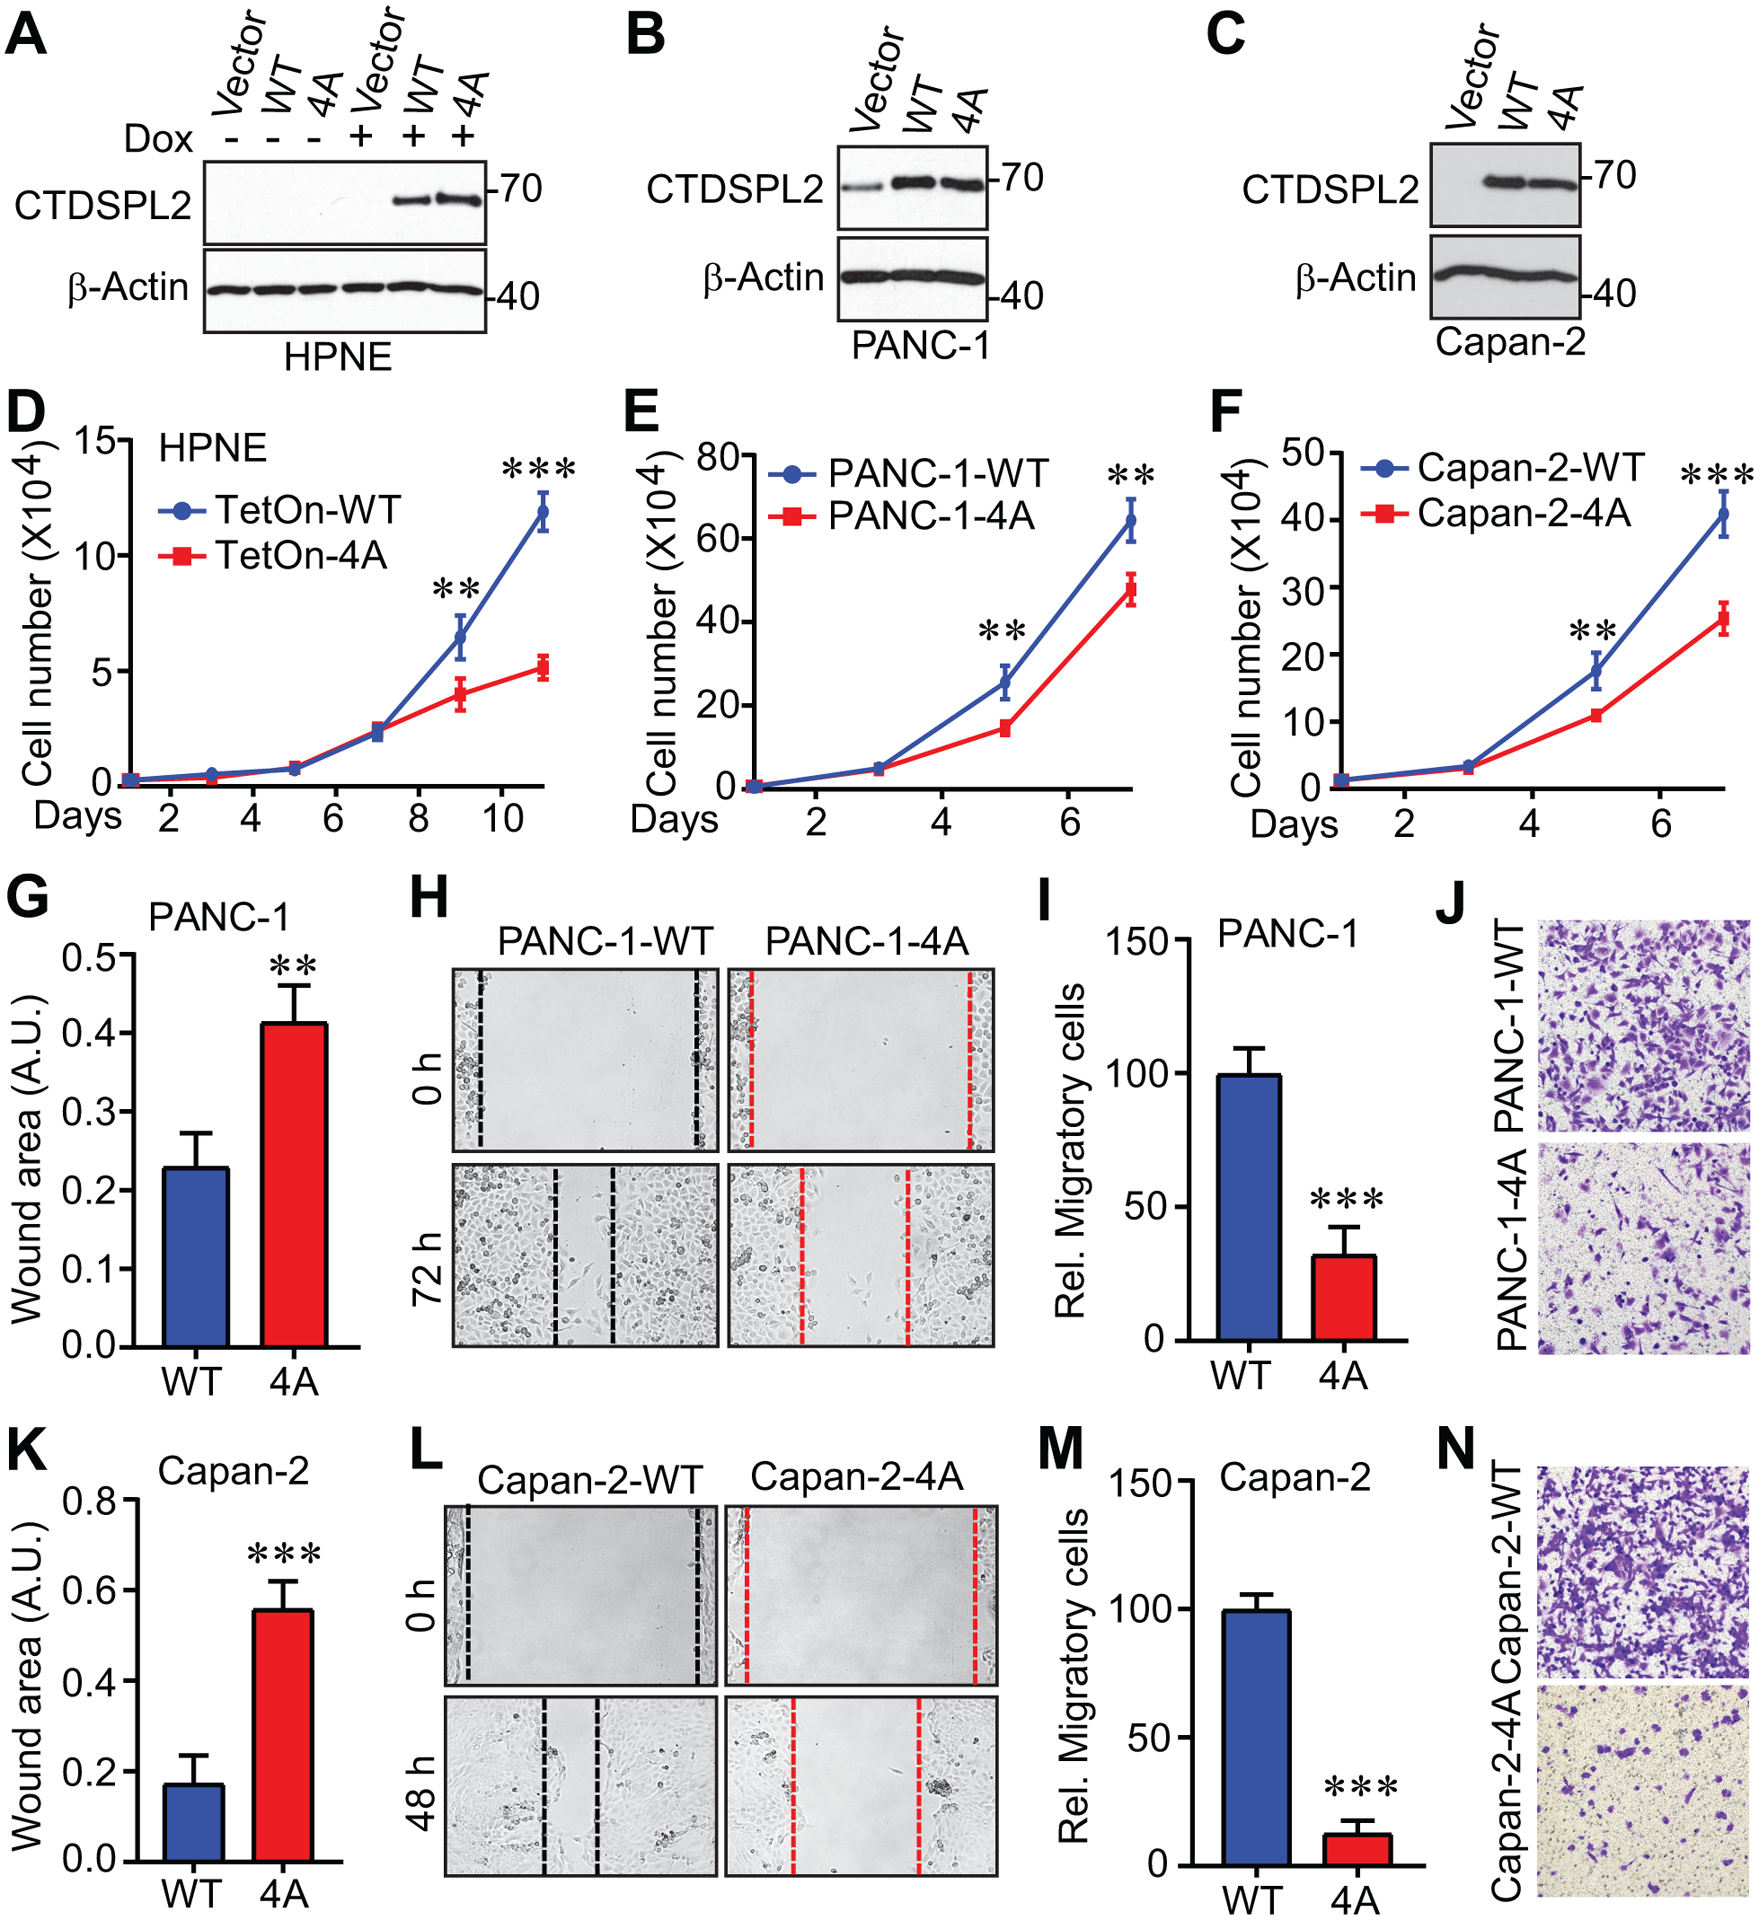
Fig. 5. Phosphorylation-deficient mutant CTDSPL2 has dominant negative effects.

(A) Expression of CTDSPL2 in TetOn inducible CTDSPL2 overexpression HPNE cells. WT: wild type. 4A: T86A/S104A/S134A/S165A. (B, C) Establishment of cell lines with CTDSPL2 overexpression in PANC-1 (B) and Capan-2 (C) cells. (D-F) Cell proliferation assays in HPNE (D) cells from A, PANC-1 (E) cells from B and Capan-2 (F) cells from C. Data were expressed as the mean ± SD of three independent experiments. **: p=0.006; ***: p=9.1E-06 in panel D. **: p=0.002 in panel E. **: p=0.003; ***: p=0.0003 in panel F (Student’s t test). (G-N) Expression of CTDSPL2–4A impaired migration in PANC-1 (G-J) and Capan-2 (K-N) cells. Both wound healing (G, H, K, L) and Transwell (I, J, M, N) assays were used to measure the cell motility. Data were expressed as the mean ± SD of three or four independent experiments. **: p=0.001 in panel G. ***: p=6.4E-05 in panel I. **: p=0.0001 in panel K. ***: p=3.9E-07 in panel M (Student’s t test).
