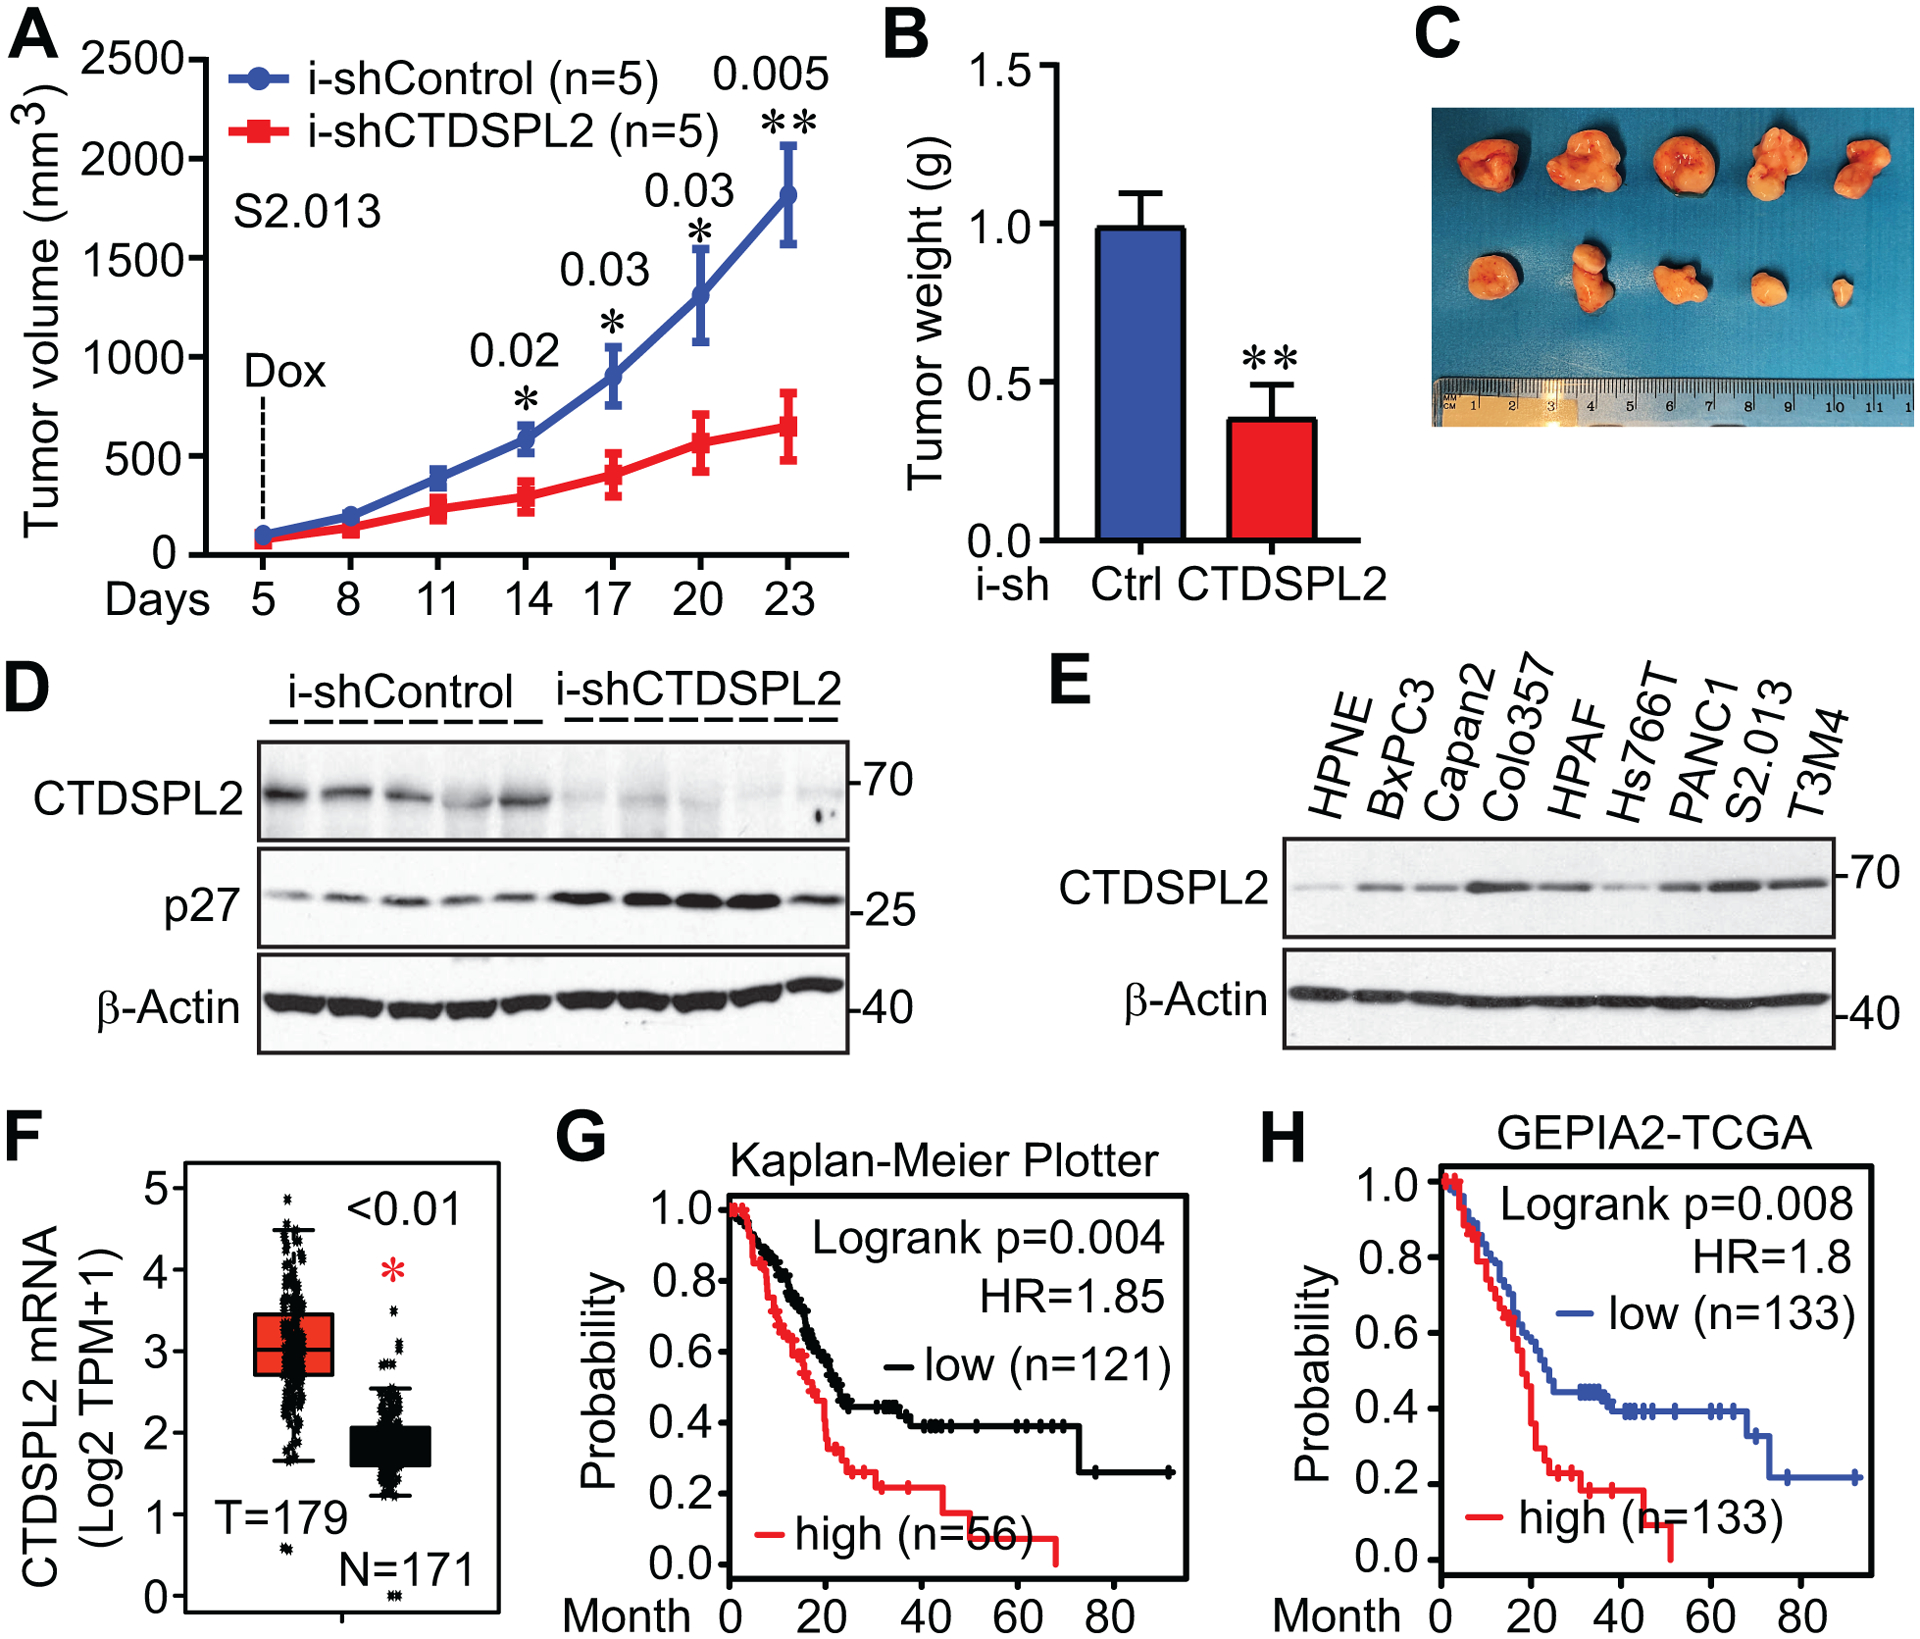
Fig. 6. CTDSPL2 ablation restrains tumor growth in vivo.

(A) Tumor growth curve of S2.013 cells with/without CTDSPL2 knockdown. Cells were subcutaneously inoculated into athymic nude mice (five mice each group). Doxycycline (1 mg/mL) was used on day 5. The tumor volume was measured at the indicated points. Data were expressed as the mean ± SEM. The p values were also shown (Student’s t test). (B) End-point tumor weight was measured. Data were expressed as the mean ± SD. **: p=0.003 (Student’s t test). (C, D) Tumors were excised and photographed at the endpoint (C) and lysed for western blotting analysis (D). (E) CTDSPL2 is overexpressed in pancreatic cancer cells. Western blotting analysis of CTDSPL2 expression in immortalized pancreatic (HPNE) and pancreatic ductal adenocarcinoma (PDAC) cell lines. (F) CTDSPL2 mRNA levels are increased in PDAC patients of TCGA datasets. The mRNA levels of CTDSPL2 in normal pancreas and pancreatic tumor samples were analyzed using an online tool (GEPIA2). (G, H) CTDSPL2 expression negatively correlated with overall survival in PDAC patients. Data were extracted from Kaplan-Meier plotter (G) and GEPIA2 (H). The cutoff values are 848 in G and 50% in H.
