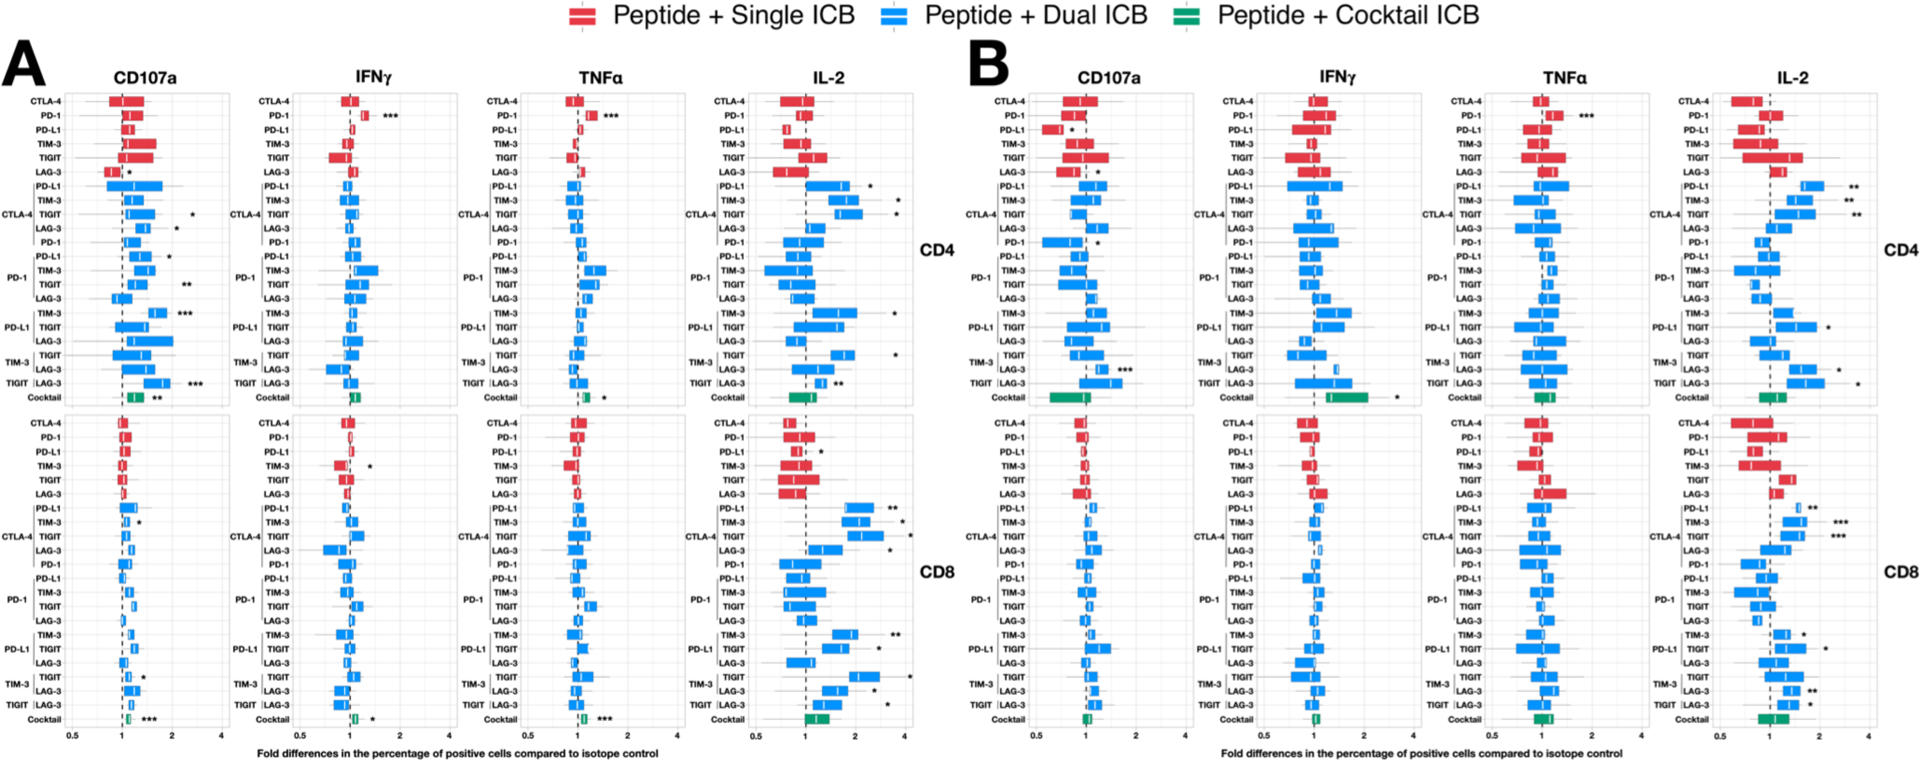
Figure 1: Fold change in the frequency of cytokine+ T cells in response to HIV peptides in the presence of antibodies to immune checkpoints (ICs) relative to isotype control.

Total CD4+ and CD8+ T-cells collected from PWH on ART were incubated with antibodies to ICs either alone (red), as dual combinations (blue) or a cocktail of six antibodies (green) following incubation with overlapping peptides to either (A) gag or (B) nef and the frequency of cells expressing CD107a, IFNγ, TNFα and IL-2 quantified by flow cytometry. The fold change increase in the presence of IC antibodies relative to isotype control is shown. Data are summarised with box plots indicating the median and inter-quartile range for the 9 participants. Asterisks indicate the significant differences between the specific antibody combination and the respective IgG isotype control(s). Statistical significance was determined by Wilcoxon Signed-Rank tests. * p < 0.05, ** p < 0.01, *** p < 0.005
