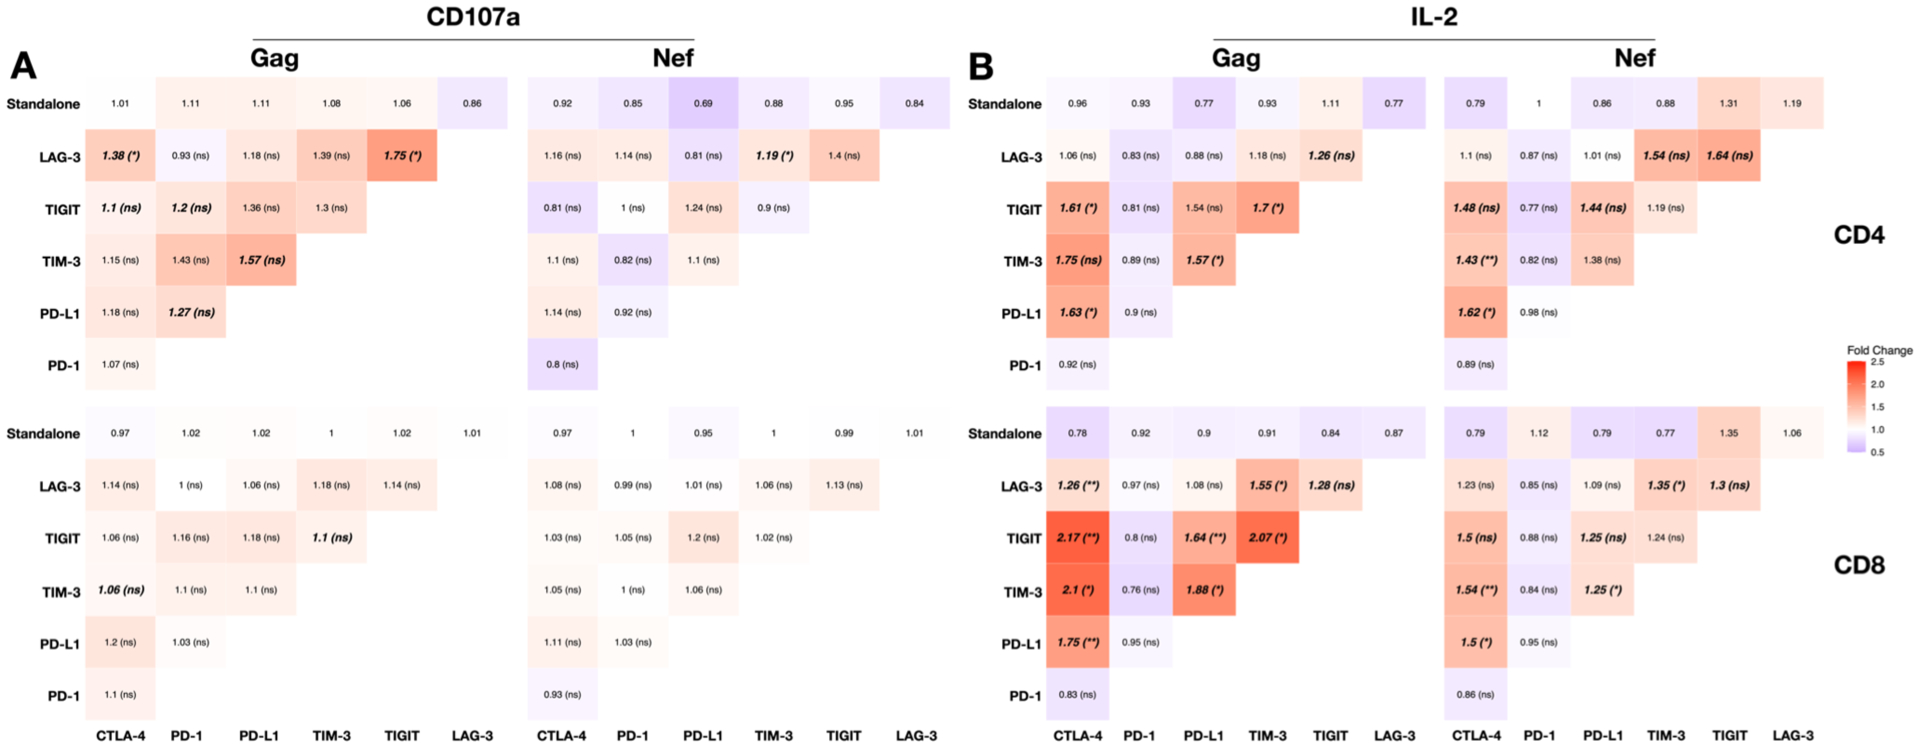
Figure 4: The magnitude and synergism of antibodies to immune checkpoints (IC) used in combination to enhance the frequency of HIV-specific T-cells producing either CD107a or IL-2.

Heat maps showing the magnitude of the fold change of number of T cells expressing (A) CD107a and (B) IL-2 following stimulation with either Gag (left panels) or Nef (right panels) peptides in CD4+ (upper) and CD8+ (lower) T cells following stimulation with one or two IC antibodies relative to isotype controls. Numbers indicate the magnitude of the fold change with one antibody (top row) or two antibodies to ICs compared to IgG isotype control. The bold numbers indicate the fold changes that were significantly higher than isotype control. The asterisks represent the statistical significance for the Bliss independence tests for the specific antibody combinations. * p < 0.05, ** p < 0.005
