
Figure 5: Heat maps showing the correlations between clinical parameters and the fold change increase in the frequency of cytokine positive cells in response to Gag and Nef peptides in the presence of antibodies to immune checkpoints.
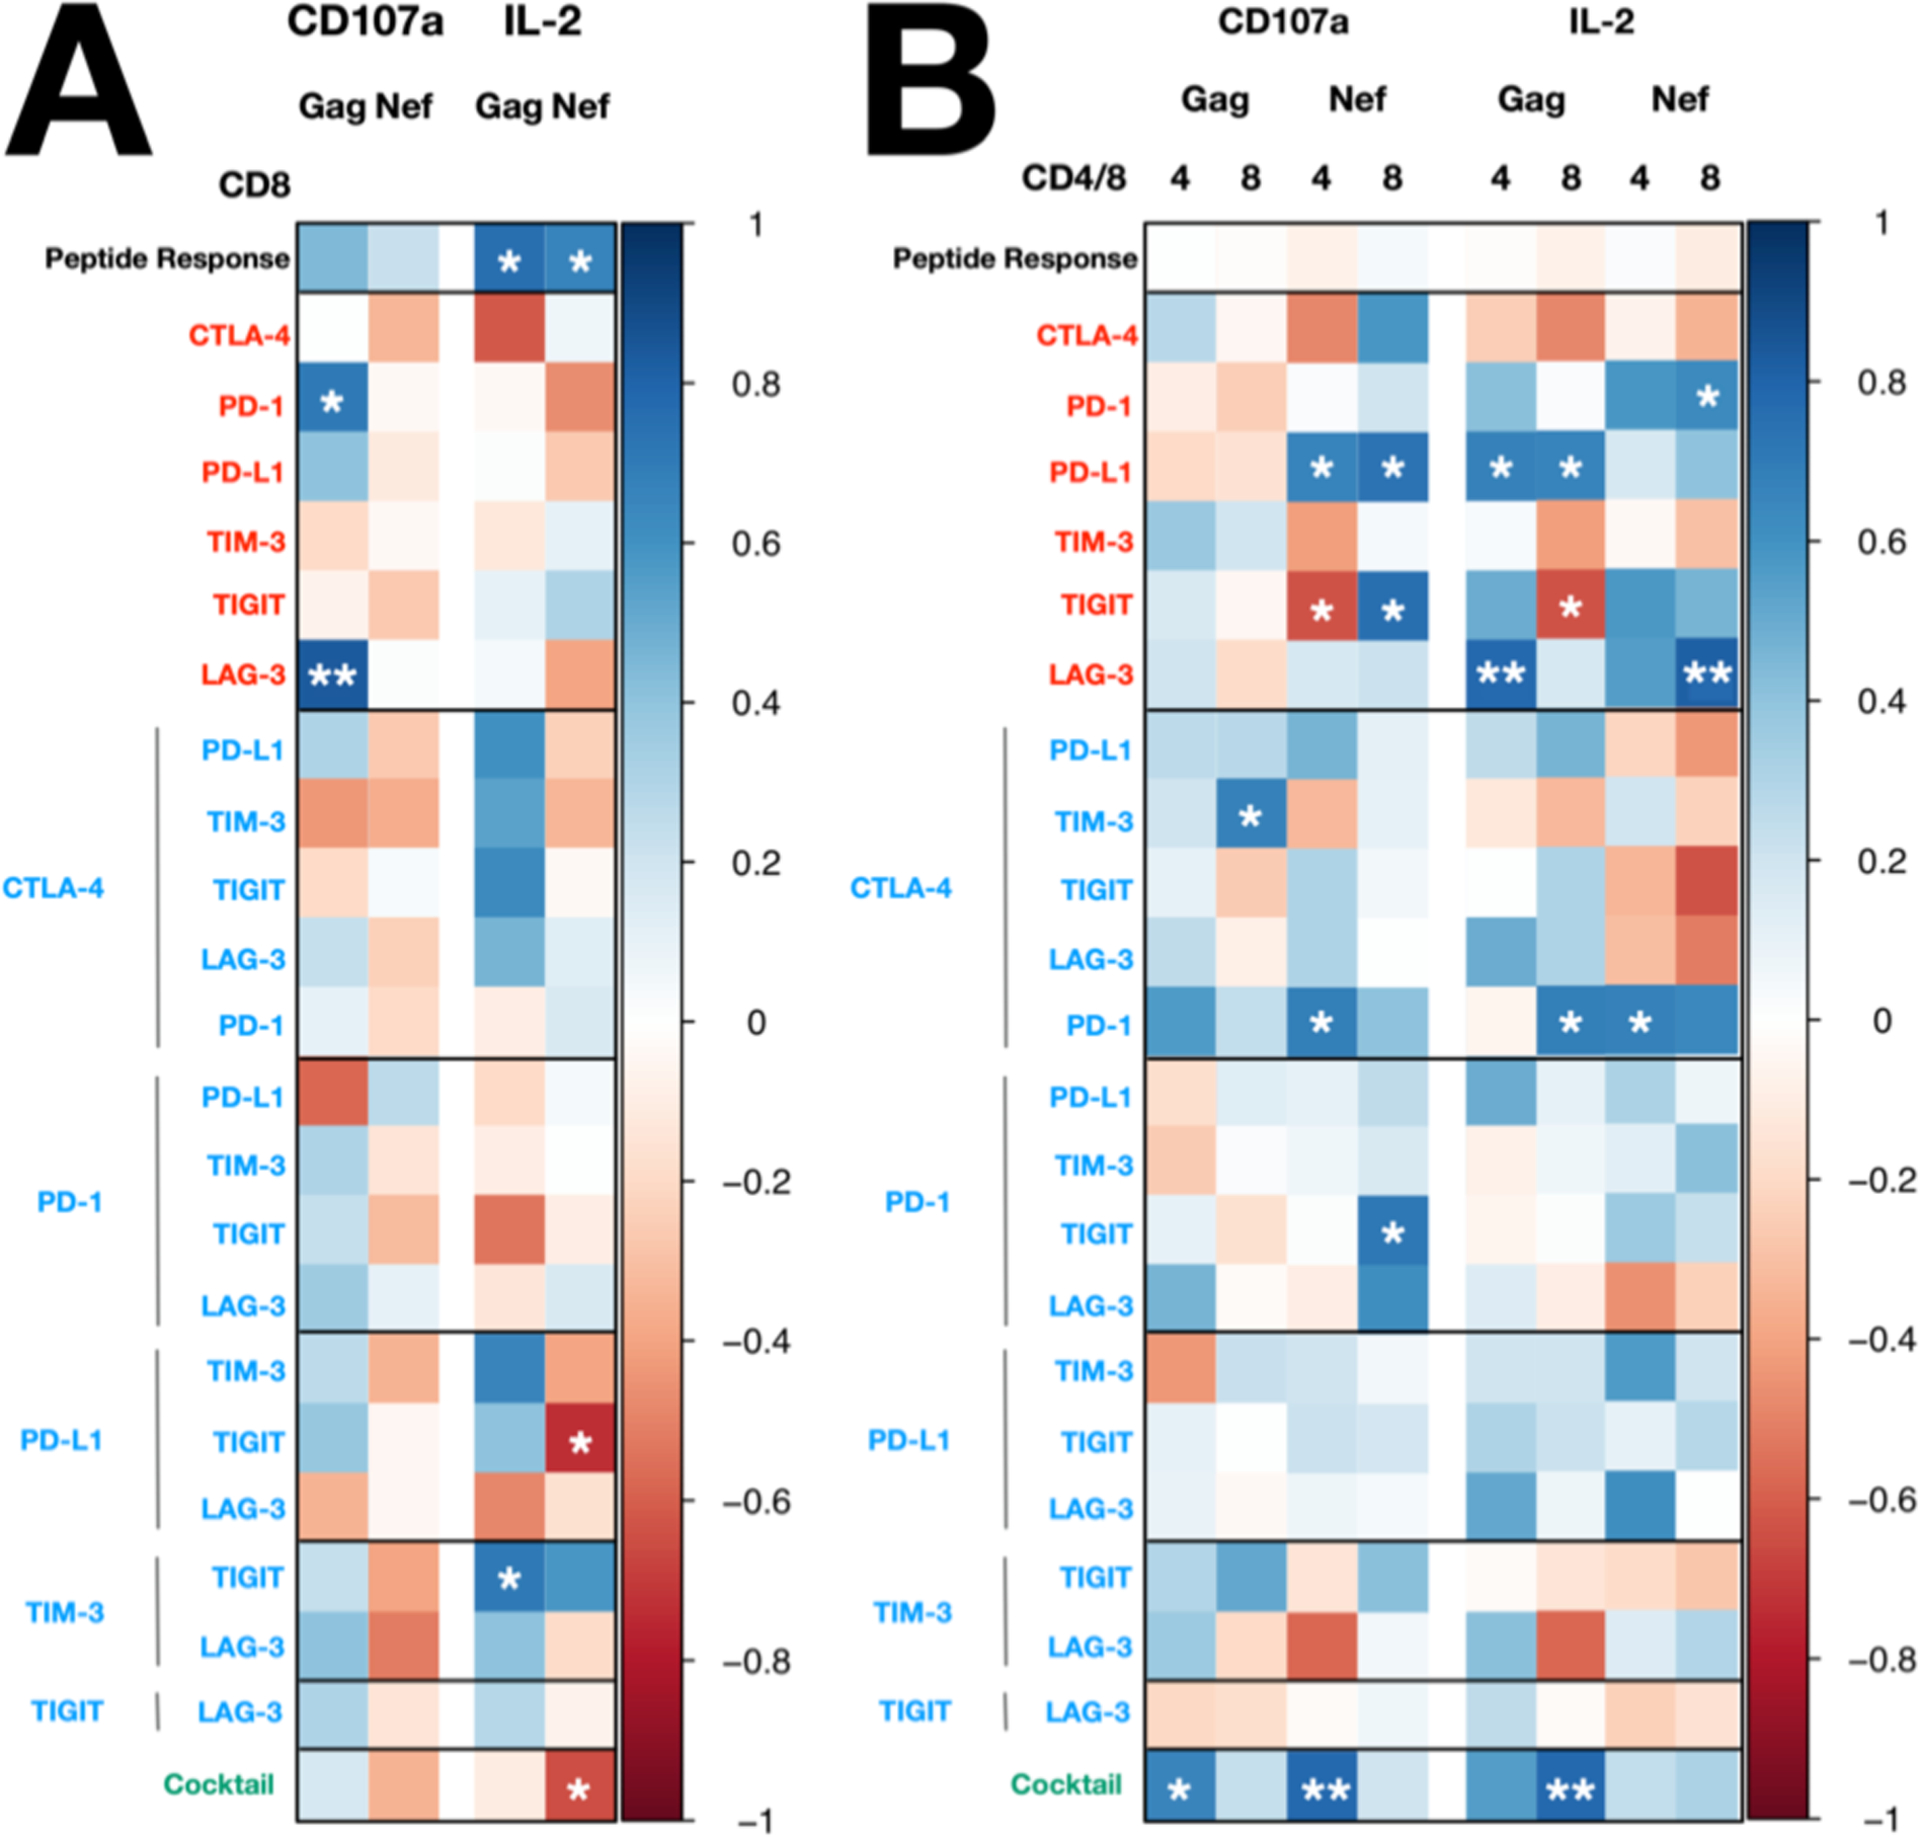
Heatmap illustrating the strength and significance of correlation coefficients between the immune checkpoint blockade response and (A) CD8 count and (B) CD4:CD8 ratio. Statistical significance was determined by Spearman’s rank correlation. Positive and negative correlations are indicated as blue and red, respectively. * p < 0.05, ** p < 0.01