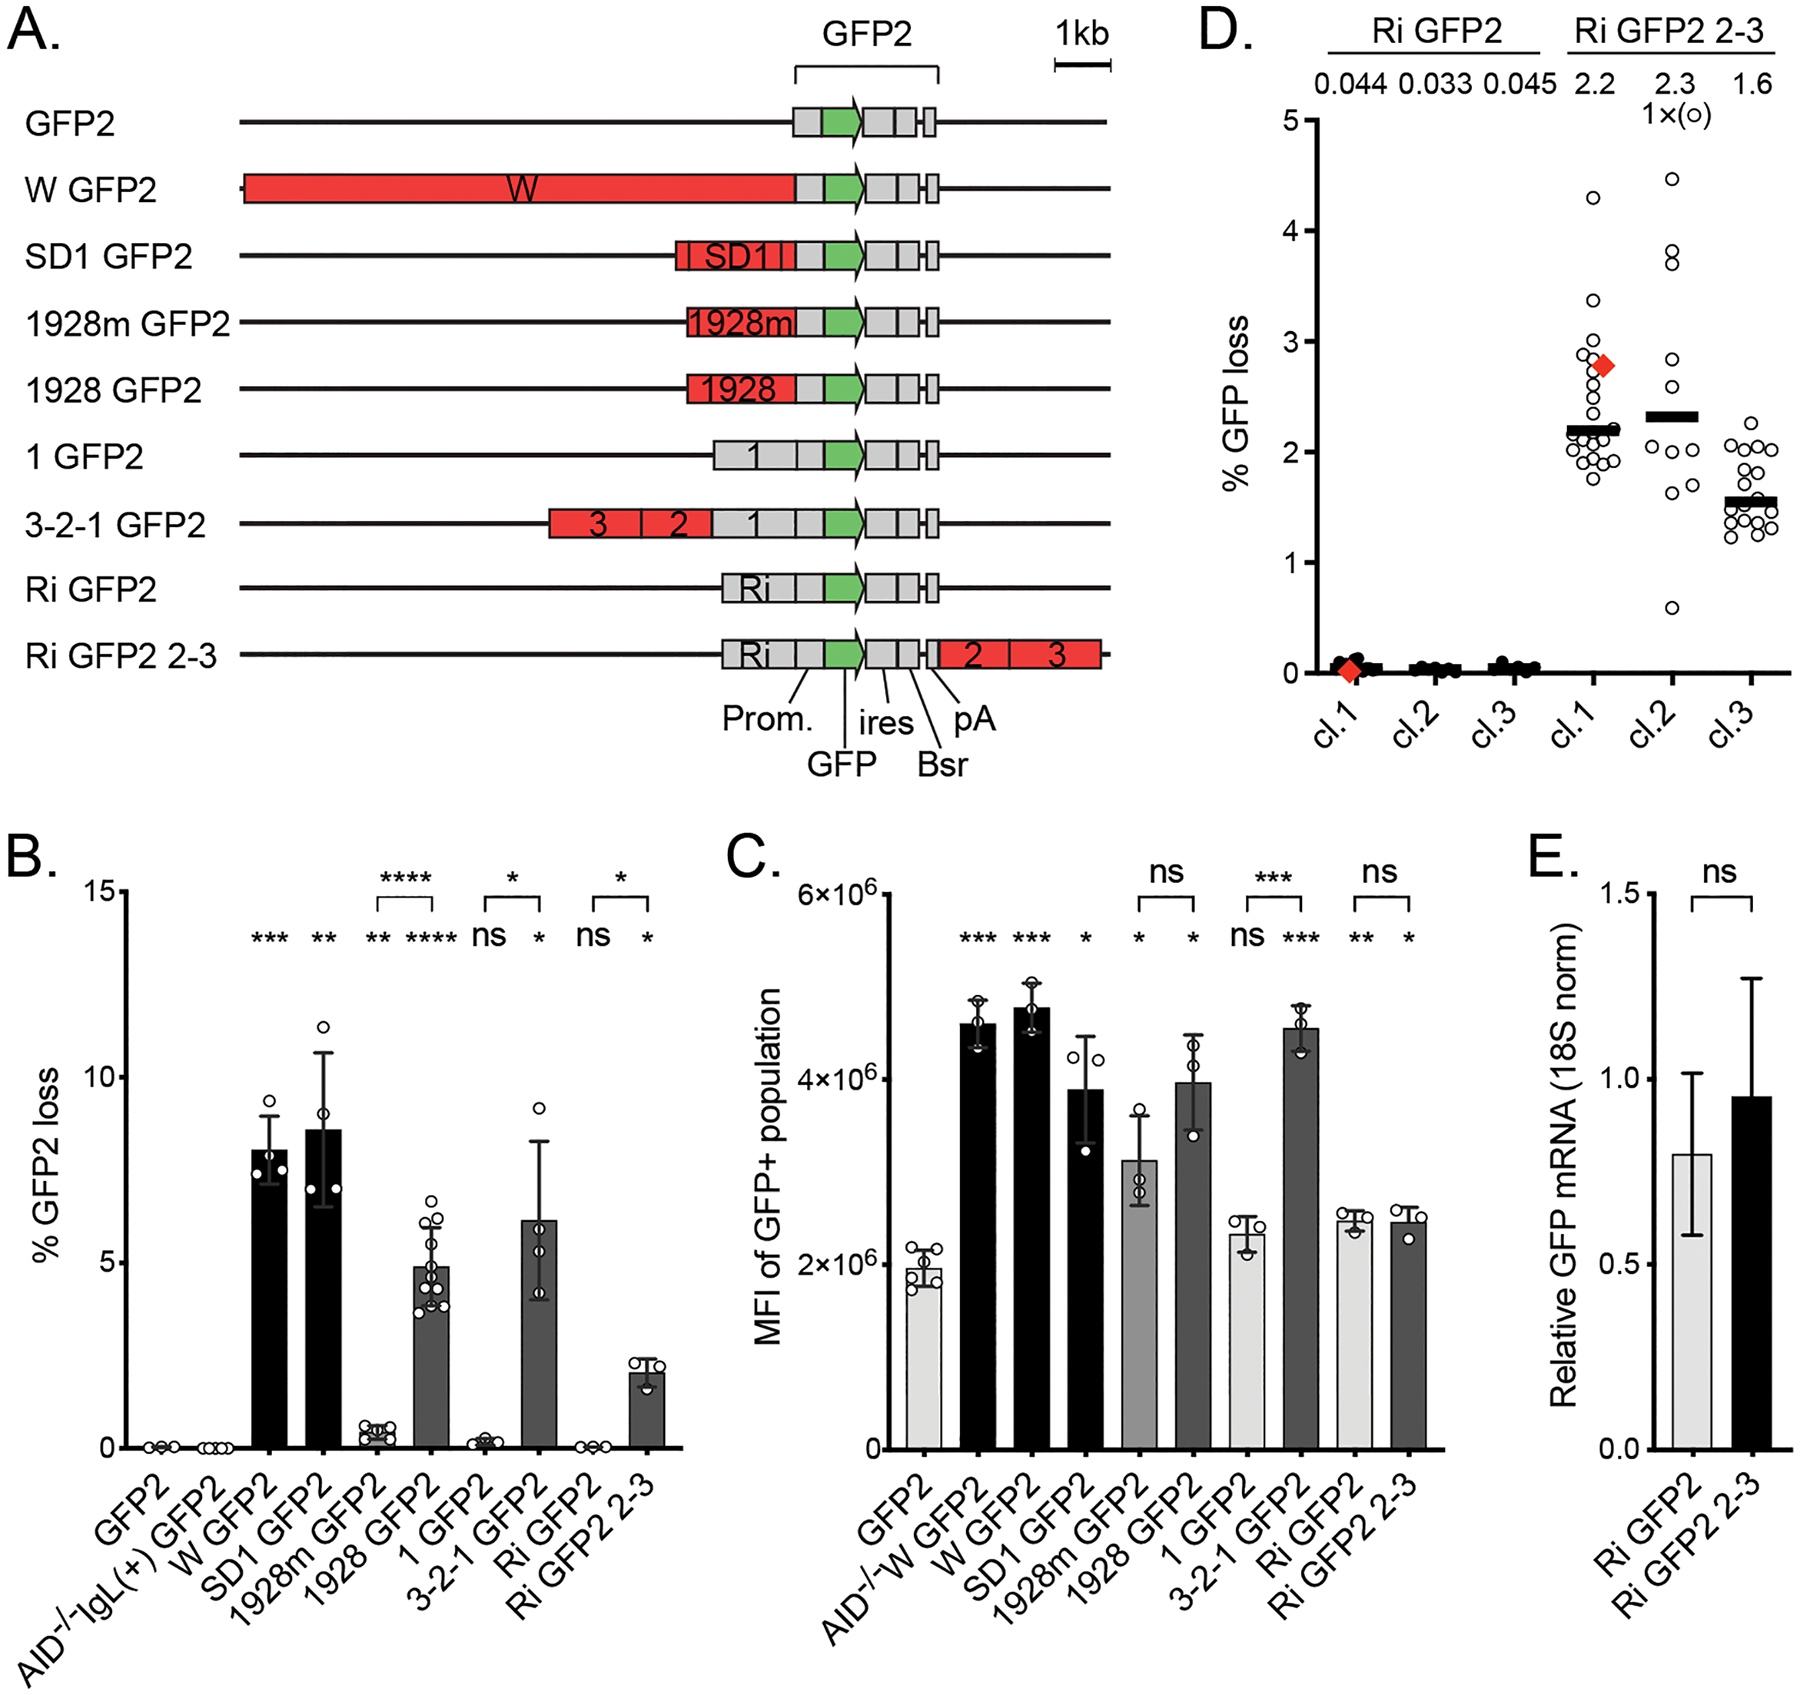
Figure 1.

Properties of the SHM reporters used in DT40 cells A. Outline of the GFP2 reporters used in DT40 cells. The reporters differ in the strength (see B) and position of the DIVACs (red) relative to the GFP gene (green). The other elements of the reporters are drawn in gray. DIVAC 3-2-1 is a 4.38 kb region of DIVAC W (33) derived from the chicken IgL locus enhancer region and contains subregions 1, 2, and 3 (30). DIVAC 2–3 is a 2.99-kb region that lacks subregion 1. DIVAC 1928 is a 1928 bp subregion of 2–3 that was trimmed from the ends and has an internal truncation (30). 1928m is E box mutant derivative of 1928 fragment (31). Ri is the intronic sequence from the mouse Rag1 gene.
B. DIVAC activity (% GFP loss) of the reporters outlined in A. Subregion 1 and Ri do not have DIVAC activity. GFP loss in AID-deficient cell line without a DIVAC or IgL deletion is shown as a control (30). The bars are shaded to reflect the activities of DIVACs: below 0.2% light gray, 0.2–1% medium gray, 1–6% dark gray, >6% black. Asterisks indicate statistical significance according to Welch’s t-test compared to GFP2 and relative negative controls as indicated. * p<0.05, ** p<0.01, *** p<0.001, **** p<0.0001, ns not significant.
C. GFP expression in cell lines with targeted integration of the reporters as measured by mean fluorescence intensity (MFI) of GFP-positive cell population. AID-deficiency does not affect the expression of GFP in W GFP2 reporter (AID−/− W GFP2). Asterisks indicate statistical significance according to Welch’s t-test compared to GFP2 and relevant negative controls as indicated. * p<0.05, ** p<0.01, *** p<0.001, ns not significant. The shading of the bars is as in B.
D. GFP loss in three independent clones of DT40 cells with Ri GFP2 or Ri GFP2 2–3, where DIVAC 2–3 is downstream of the GFP2 cassette. The median percentage of GFP-negative cells after the 14-day assay period of subclones is indicated. One subclone from Ri GFP2 clone 1 and Ri GFP2 2–3 clone 1 each (red diamonds) are used for C, E, and subsequent analyses. Data point outside the y-axis range is in parenthesis.
E. Expression of GFP mRNA from integrated Ri GFP2 and Ri GFP2 2–3 reporters using RT-qPCR. The GFP expression is normalized to 18S RNA. The difference is not significant according to Student’s t-test.
