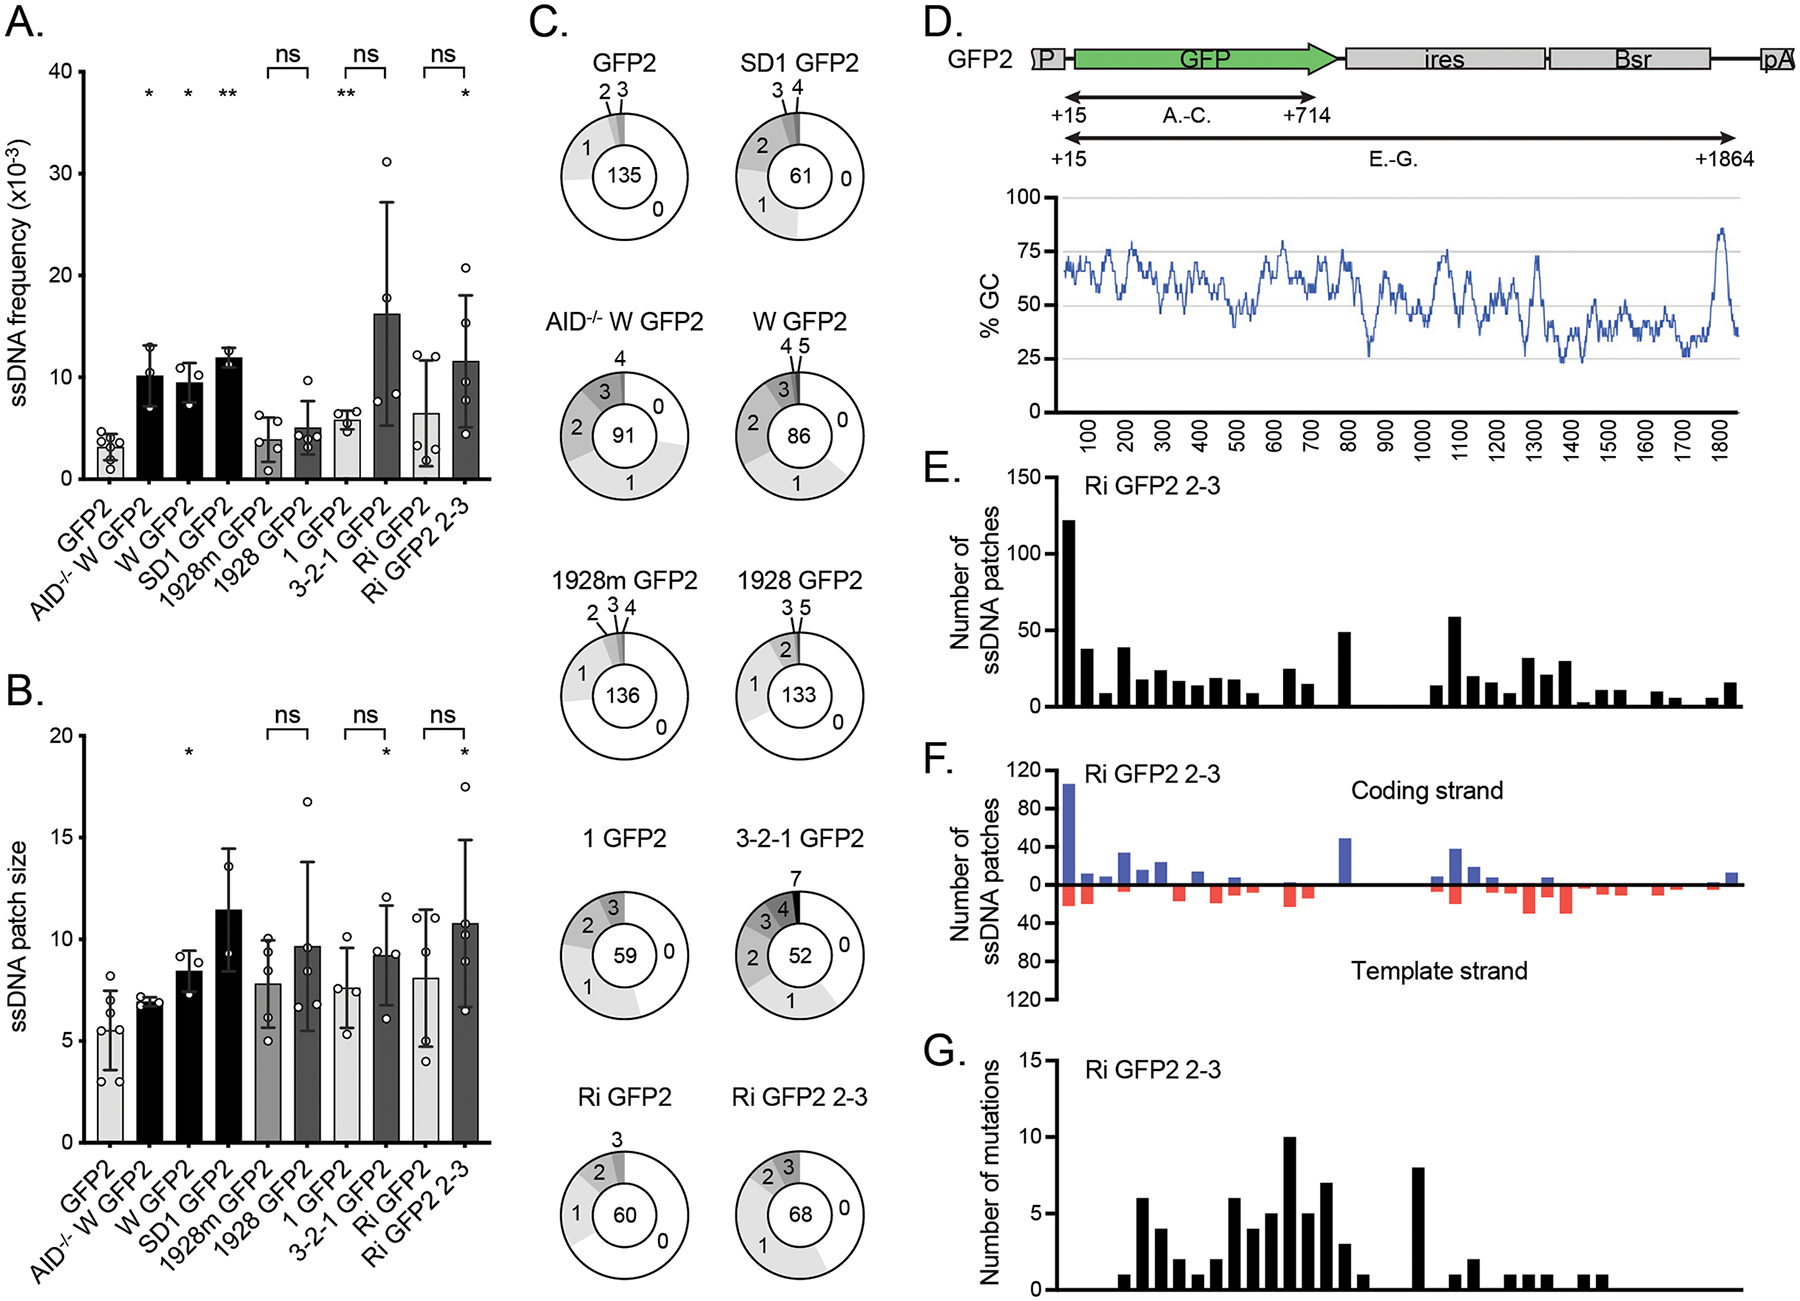
Figure 6.

The effect of DIVACs on ssDNA A. The frequency of ssDNA in the reporters assayed by in situ bisulfite assay (ratio of modified ssCs in patches to all the sequenced Cs) in the region TSS +15 bp to TSS +714 bp as indicated in D. To be counted as a single-stranded patch, a minimum of 2 consecutive C-to-T or G-to-A mutations were required. The asterisks indicate statistical significance according to Welch’s t-test when compared to GFP2. Lack of significance of additional comparisons are indicated. * p<0.05, ** p<0.01, ns not significant. The shading of the bars is as in Figure 1B.
B. The size of ssDNA patches (mean of minimum and maximum possible patch size) in the same region of the reporters as in A. The asterisks indicate statistical significance according to Welch’s t-test when compared to GFP2. Lack of significance of additional comparisons are indicated. * p<0.05, ns not significant. The shading of the bars is as in Figure 1B.
C. Distribution of ssDNA patches detected per sequence in the same region of the reporters as in A. The numbers indicate the numbers of patches per sequence and the number in the middle indicates the total number of analyzed sequences.
D. The location (upper panel) and GC content (bottom panel) of the regions along the GFP2 transcription unit in which the ssDNA and mutations were analyzed in A-C as well as in E-G. The GC content is plotted with a 30-bp window.
