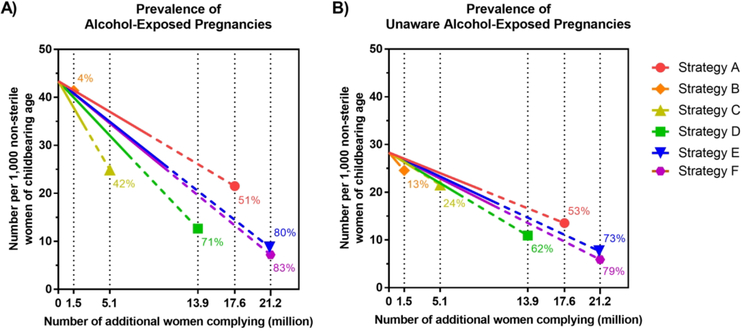
Figure 5.
Change in the prevalence of alcohol-exposed pregnancies (AEPs) and unaware AEPs under strategies defined in Table 1. The x-axis represents the number of non-sterile, women of reproductive age who: under strategy A, switch to effective contraceptives (with less than 10% probability of failure in one year of use) from not using contraceptives at all or using ineffective methods; under strategy B detect their pregnancies within a week of a missed period; under strategy C, abstain from drinking if seeking pregnancy or pregnant; under strategy D, abstain from drinking if pregnant, seeking pregnancy or not using contraceptives with sex; under strategy E, comply with strategies A and C; and under strategy F comply with strategies A-C. Solid lines and dotted lines assume up to 0–50% and >50–100% adherence, respectively. Vertical dotted lines represent the maximum number of women that could be reached through each strategy in the U.S. The numbers next to each line represent the maximum percentage reduction in the prevalence of AEP or unaware AEP under each strategy. The slopes of these lines are provided in Table S8. See Fig. S8 for the prevalence of pregnancies that are exposed to ≥5 or ≥9 alcoholic drinks in a week during the pregnancy under strategies defined in Table 1.

