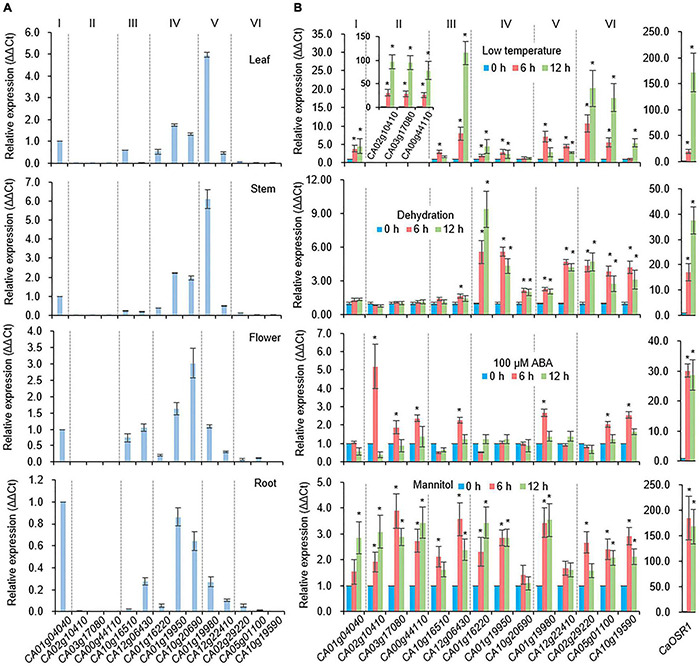
FIGURE 2.

Expression patterns of CaSAP genes. (A) Tissue-specific expression of CaSAP genes. The expression levels of CaSAP genes were determined via qRT-PCR analysis using cDNA derived from the first- and second-leaves, stems, and roots harvested from the six-leaf stage pepper plants and fully opened flowers. Values for CA01g04040 were set to 1.0. (B) Expression levels of CaSAP genes in response to different abiotic stresses. Expression levels of CaSAP genes were determined via qRT-PCR analysis using cDNA derived from the first and second leaves of pepper plants (six-leaf stage) subjected to different abiotic stresses: dehydration (shoot detachment), ABA (100 μM), mannitol (600 mM), and low temperature (10°C). The relative expression (ΔΔCT) of CaSAP genes was normalized to that of CaACT1, which was used as an internal control gene, and values at 0 h were set to 1.0. Values are presented as the mean ± standard error of values from three independent experiments. Asterisks indicate significant differences compared to the value at 0 h for each gene (Student’s t-test; *P < 0.05).
