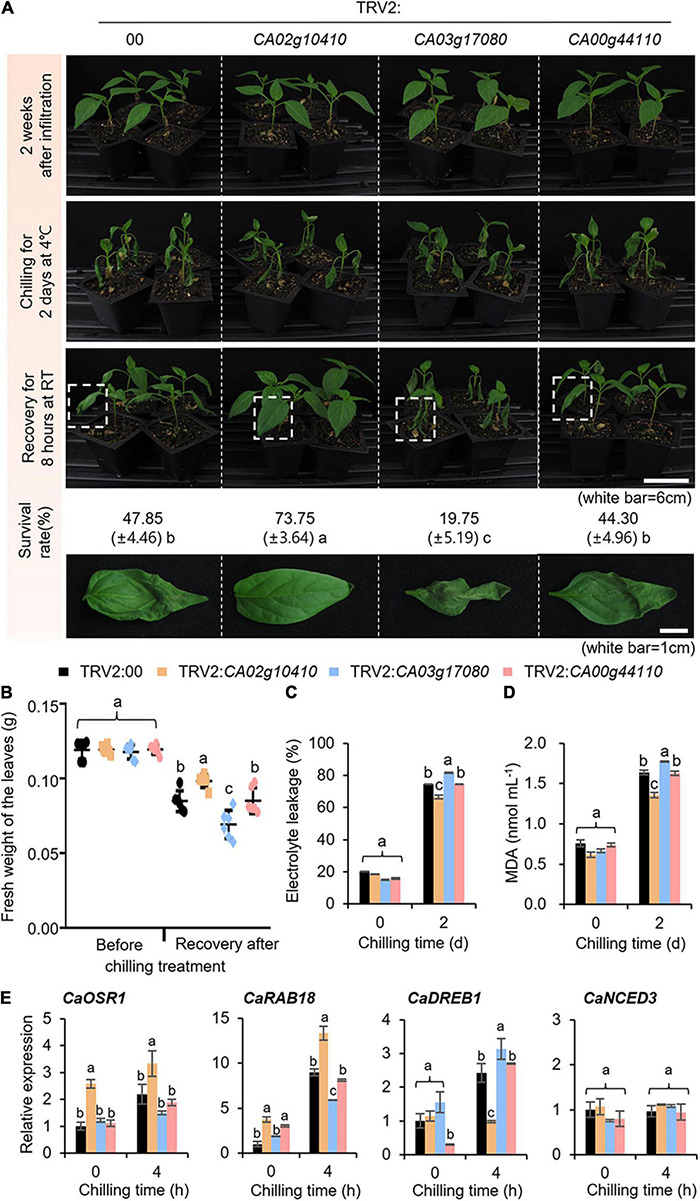
FIGURE 4.

Phenotypic analysis of group II CaSAP genes to low temperature. (A) The low-temperature phenotypes of group II TRV2:CaSAP. Four-week-old plants of each line were subjected to the low temperature stress by chilling (4°C) for 2 days, followed by recovery for 8 h and the survival rates of each line were calculated. (B) The relative fresh weights of each line were calculated prior to chilling and after recovery. (C,D) Effect of low temperature stress on electrolyte leakage (C) and lipid peroxidation (D) in the leaves of TRV2:00 and group II TRV2:CaSAP pepper plants. Four-week-old plants were subjected to the low temperature (4°C) for 2 days, as shown in (A) (n = 20 plants of each line per replicate, 3 replicates). (E) Expression analysis of low temperature-inducible genes in the leaves of TRV2:00 and group II TRV2:CaSAP pepper plants. The relative expression (ΔΔCT) of CaSAP was normalized to that of CaACT1, which was used as an internal control gene. All values are presented as the mean ± standard error of values obtained from three independent experiments. Different letters indicate significant differences among the control and TRV2:CaSAP pepper plants (ANOVA; P < 0.05).
