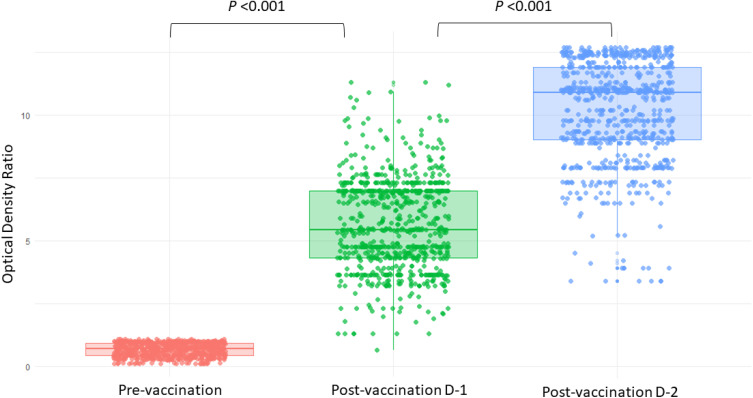
Figure 2.
Jitter-box plots showing antibody levels at pre-vaccination, post-vaccination dose 1 and post-vaccination dose 2 among participants. P-value was determined by Wilcoxon Signed Rank test. P <0.001 between (i) pre-vaccination and post-vaccination dose-1, and between (ii) post-vaccination dose-1 and post-vaccination dose-2. Person without infection had Optical Density Ratio (ODR) below 0.8 at pre-vaccination period hence a smoothened appearance.
Abbreviations: D-1, Dose 1; D-2, Dose 2.

