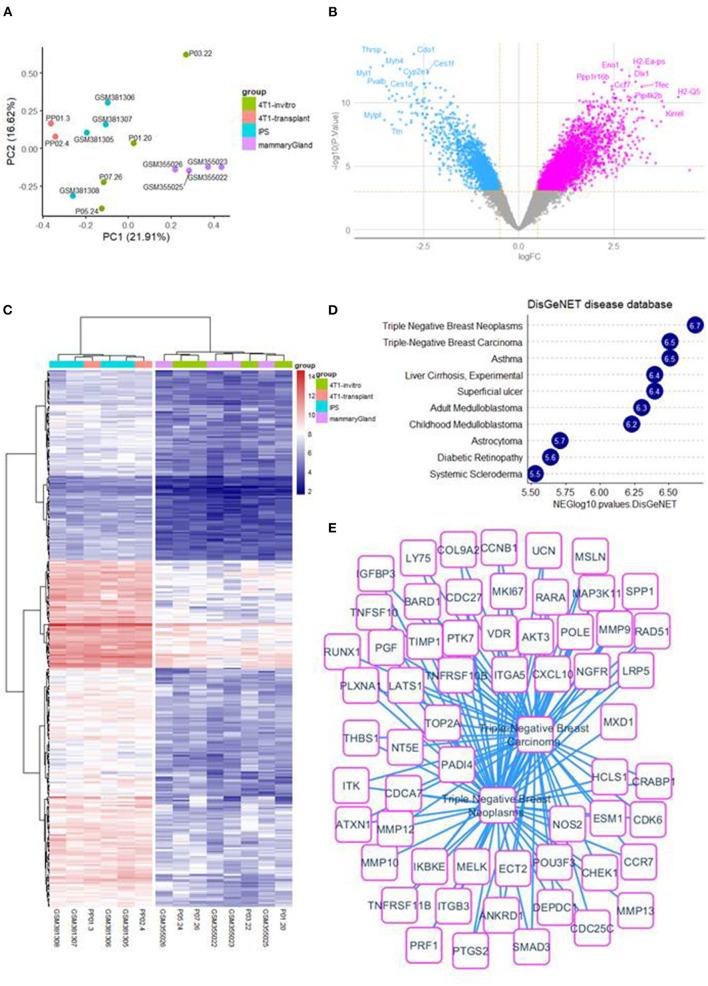
Figure 1.
4T1-transplant samples involved a TNBC up regulated expression profile: (A) whole transcriptome principal component analysis stratify on experimental groups. (B) Volcanoplot of LIMMA analysis comparing 4T1-transplant and 4T1 in vitro. (C) Expression heatmap on up regulated genes between 4T1-transplant and 4T1 in vitro condition. (D) Barplot of functional enrichment performed on DisGeNET with up regulated genes in 4T1-transplant condition. (E) Functional enrichment network involving triple negative breast cancer expression profile for 4T1-transplant up regulated genes.

