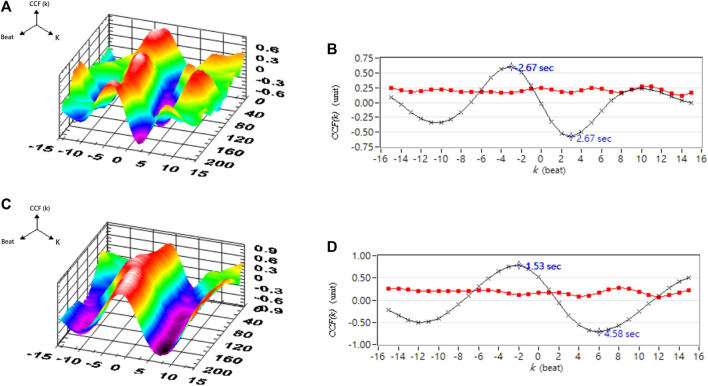
FIGURE 12.
A typical healthy person’s blood pressure and cerebral blood flow correlation analysis. (A) 3D representative CCF figures in supine position. (B) 2D representative figures of CCF in supine position. (C) 3D representative figures of CCF in head-up tilt position. (D) 2D representative figures of CCF in head-up tilt position. CCF(k) is the CCF value in the time indices. The mean (–×–) and standard deviation (–■–) of CCF value in each time index k.

