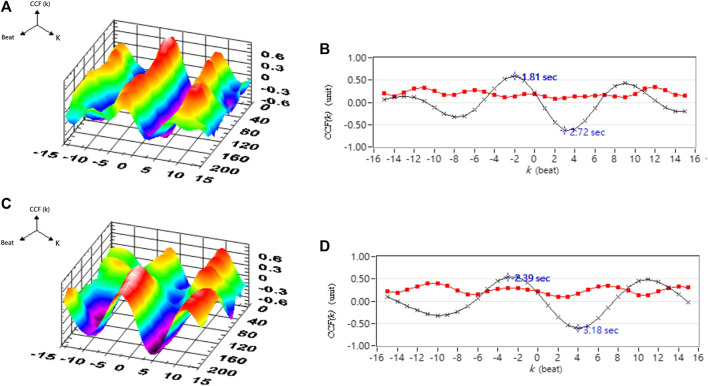
FIGURE 13.
Analysis results of correlation between blood pressure and cerebral blood flow in a typical hypertensive patient. (A) 3D representative figures of CCF in supine position. (B) 2D representative figures of CCF in supine position. (C) 3D representative CCF figures in head-up tilt position. (D) 2D representative CCF figures in head-up tilt position. CCF(k) is the CCF value in the time indices. The mean (–×–) and standard deviation (–■–) of CCF value in each time index k.

