FIGURE 9.

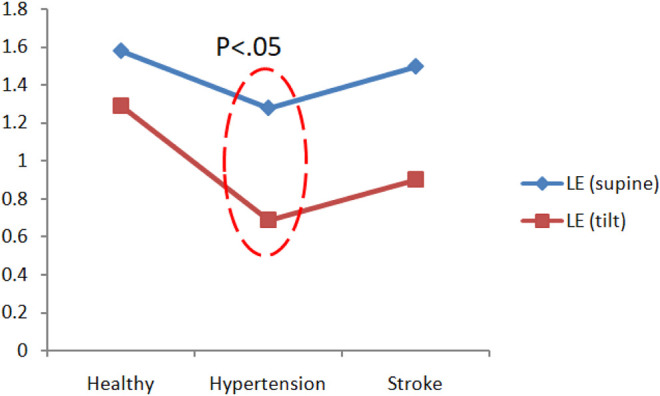
Comparison of blood pressure Lyapunov exponent (LE) analysis of healthy people, hypertension patients, and stroke patients.

Comparison of blood pressure Lyapunov exponent (LE) analysis of healthy people, hypertension patients, and stroke patients.