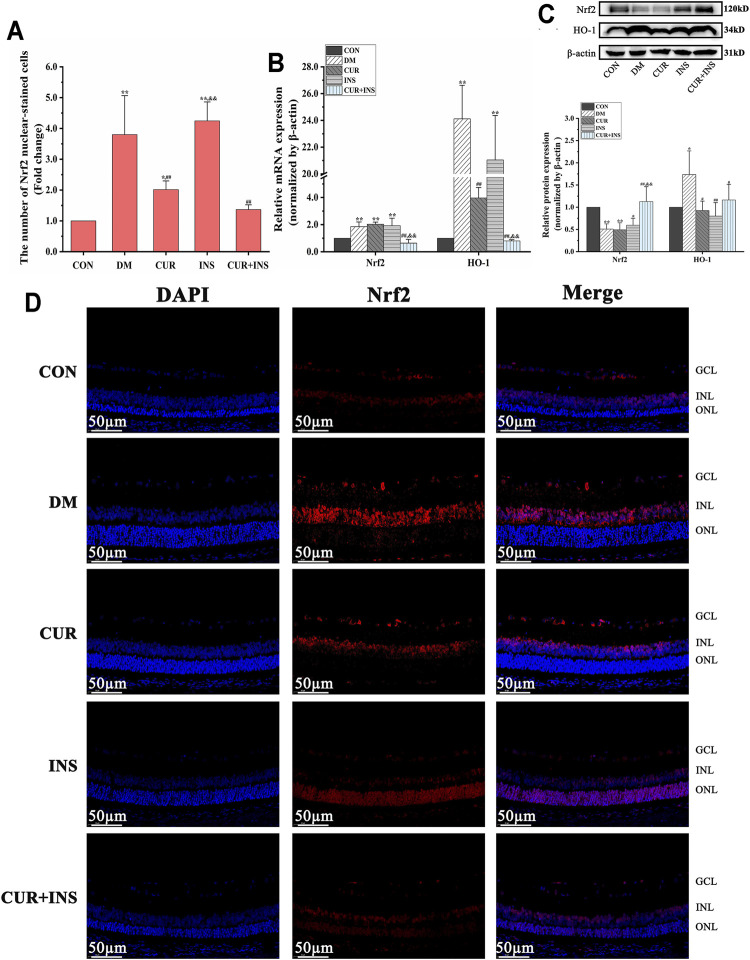
FIGURE 2.
Effects of treatment on the expression levels of Nrf2 pathway in the retina of rats. (A) The Nrf2 nuclear-stained cells in retinas of rats among different groups. (B) The relative mRNA expression levels of Nrf2 and HO-1. (C) Quantification of immunoblots of Nrf2 and HO-1 (D) Nrf2 immunofluorescence staining sections (bar = 50 µm). CON, control group; DM, STZ-induced diabetic model group; CUR, 200 mg/kg curcumin treatment group; INS, long-acting insulin treatment group; CUR + INS, 200 mg/kg curcumin and long-acting insulin treatment group. All data are expressed as the mean ± standard deviation (n > 3). ** p < 0.01 vs. the CON group; * p < 0.05 vs. the CON group; ## p < 0.01 vs. the DM group; # p < 0.05 vs. the DM group; && p < 0.01 vs. the CUR group.

