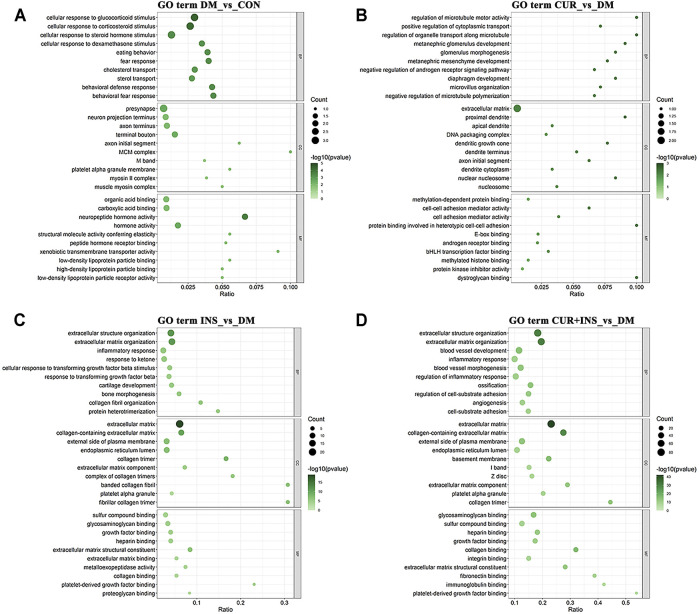
FIGURE 5.
Top 10 most significantly Gene Ontology (GO) functional enrichment analysis terms of differentially expressed genes in three types of functions: biological process (BP), cellular component (CC), and molecular function (MF). Bubble diagram showing the enriched GO results from the DM-vs-CON (A), CUR-vs-DM (B), INS-vs-DM (C), and (CUR + INS)-vs-DM (D) comparisons. Y-axis: the significantly GO category entries; X-axis: the Ratio of the number of genes enriched by differentially expressed genes to the GO item and the number of genes enriched by all genes to the GO item. The color of the bubble represents the enrichment significance p-value, and the size of the bubble represents the number of differentially expressed genes.

