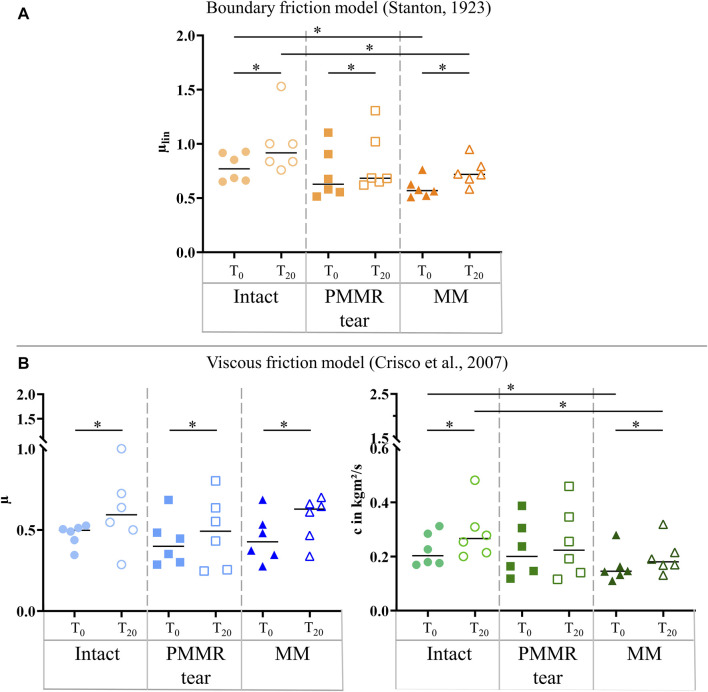
FIGURE 7.
(A) Scatter plots (median with individual values) of the boundary friction coefficient (µlin, symbol color: orange) under swing phase conditions. (B) Scatter plots (median with individual values) of the viscous friction coefficient (µ, symbol color: blue) and the viscous damping coefficient (c, symbol color: green) in kgm2/s under swing phase conditions. Each joint was tested in three consecutive meniscus states: intact (symbol shape: circles), with a posterior medial meniscus root tear (PMMR tear) (symbol shape: squares) and medial meniscectomy (MM) (symbol shape: rectangles). The tests were performed directly after loading the joints with 250 N (T0, filled symbols) and after resting under the axial load for 20 min (T20, unfilled symbols). Non-parametric statistical analyses: n = 6; *p < 0.05.

