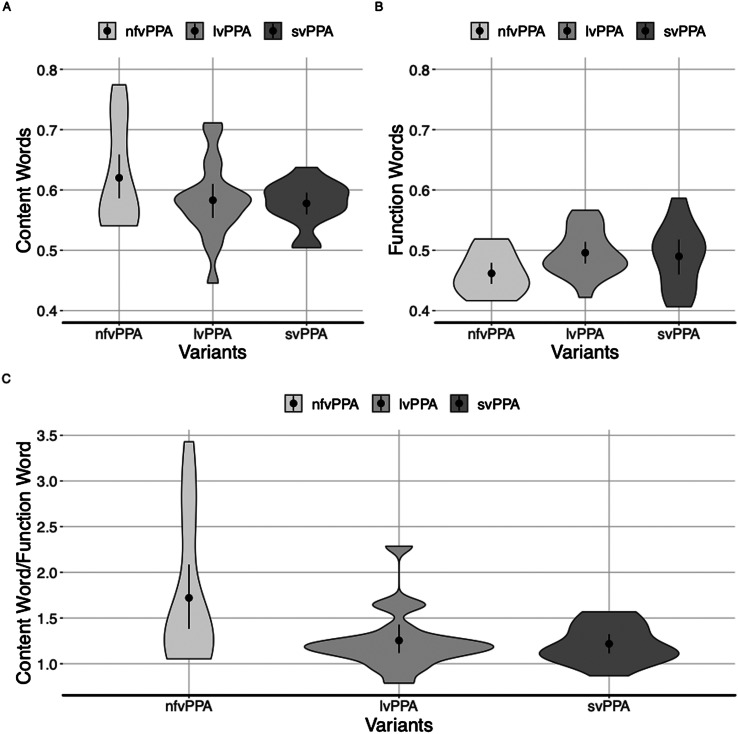
Figure 1.
Violin plots with the proportion of content (A), function words (B), and the content/function word ratio (C). The shape of the plots indicates the probability density of the data. Dots indicate the means and error bars indicate 95% confidence intervals. PPA = primary progressive aphasia; nfvPPA = nonfluent PPA variant; lvPPA = logopenic PPA variant; svPPA = semantic PPA variant.

