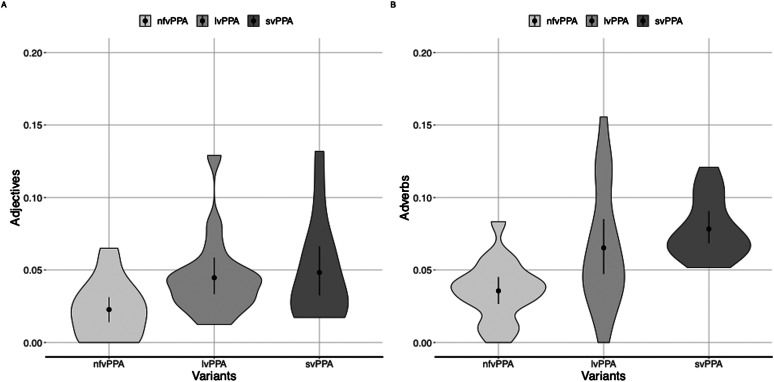
Figure 4.
Violin plots with the distribution of adjectives (A) and the distribution of adverbs (B) normalized to the total number of words produced by patients with nfvPPA, lvPPA, and svPPA. The shape of the plots indicates the probability density of the data. Dots indicate the means and error bars indicate 95% confidence intervals. PPA = primary progressive aphasia; nfvPPA = nonfluent PPA variant; lvPPA = logopenic PPA variant; svPPA = semantic PPA variant.

