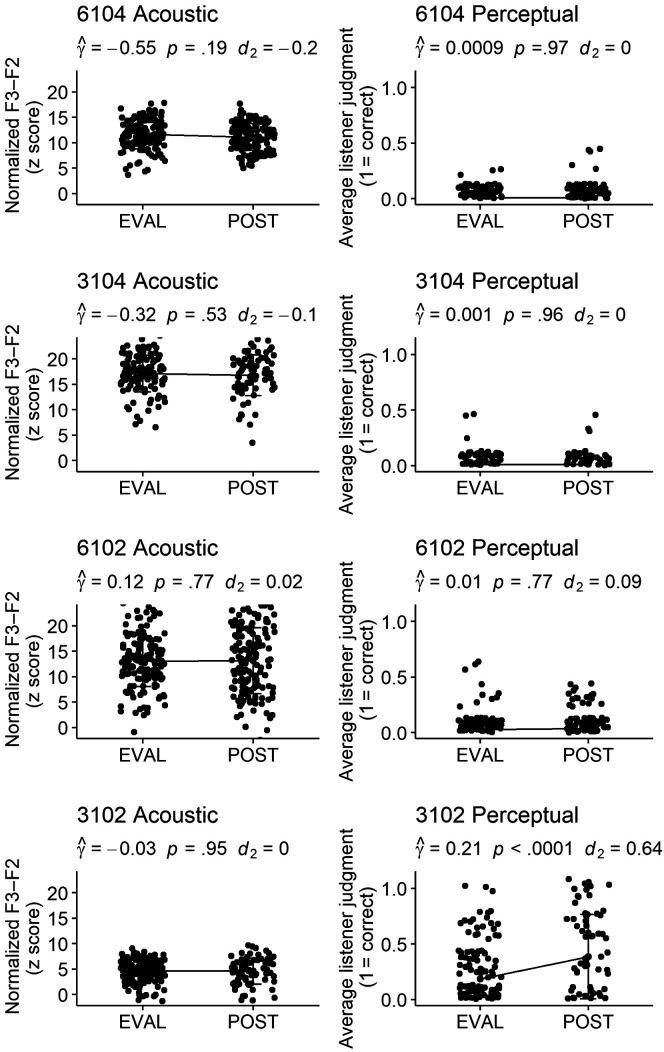
Figure 5.
Participants not demonstrating generalization from pretreatment to posttreatment. Graphs representing change from baseline to posttreatment on acoustic and perceptual measures for four participants judged to show no generalization to untrained words. The coefficient and significance of participant-level random slopes is provided, as well as effect size measures of pre-to-post change. For acoustic response (left side), lower plotted values represent a more adultlike production. F3–F2 distance is measured in Hertz, but as a z-standardized score, the y-axis for age- and gender-normalized F3–F2 is unitless. The perceptual ratings (right side) reflect the average of three listeners' perceptual judgment: 1 = unanimously correct, 0 = unanimously incorrect. Bars represent standard deviations. Perceptual points have been jittered to prevent overlap obscuring data visualization.

