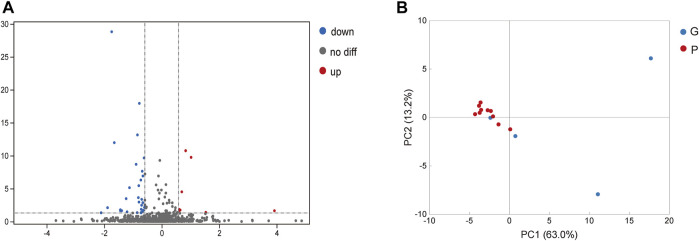
FIGURE 2.
Analysis of differentially expressed proteins in saliva. (A) Blue spot indicates the downregulated differently expressed protein, while red spot indicates the upregulated. Black spot represents the proteins with no different expression. Volcano-plot with a 5% FDR and limit of ± 1.5 in fold change in difference of mean quantification. (B) Blue spot indicates the differently expressed protein in G group, while red spot indicates the P group. PCA plot of individuals with G and P groups based on the differentially expressed proteins showed a partial separation of the groups.

