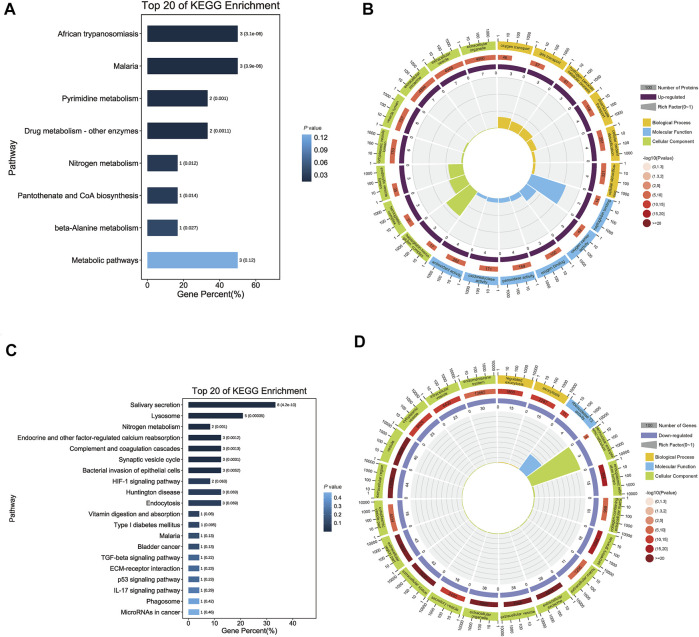
FIGURE 3.
Functional annotation of differentially expressed salivary proteins. (A) The bar chart shows the top 20 significantly enriched KEGG pathways that up-regulated proteins were involved. Each bar represents a pathway, the color of the bar represents the enrichment significance of the pathway, and the darker the color is, the smaller the p-value is; and the value on the bar is the number of pathways and p-value. African trypanosomiasis, Malaria and Metabolic pathways had the same numbers, but the first two had smaller p-value. (B) The enrichment circle diagram shows the top 20 significantly enriched GO terms that up-regulated proteins were involved. The first circle means the name of pathways and different colors represent different A classes. The second circle shows the number and p-value of this pathway in background genes. The more genes, the longer the bar and the smaller the p-value, the redder the color. The third circle showed the proportion of up-regulated genes. And the fourth circle showed the rich factor value of each pathway. In GO terms, haptoglobin binding had the highest rich factor. (C) The bar chart shows the top 20 significantly enriched KEGG pathways that down-regulated proteins were involved. Each bar represents a pathway, the color of the bar represents the enrichment significance of the pathway, and the darker the color is, the smaller the p-value is; and the value on the bar is the number of pathways and p-value. Salivary secretion had the most numbers. (D) The enrichment circle diagram shows the top 20 significantly enriched GO terms that down-regulated proteins were involved. The first circle means the name of pathways and different colors represent different A classes. The second circle shows the number and p-value of this pathway in background genes. The more genes, the longer the bar and the smaller the p-value, the redder the color. The third circle showed the proportion of up-regulated genes. And the fourth circle showed the rich factor value of each pathway. In GO terms, perinuclear endoplasmic reticulum had the highest rich factor.

