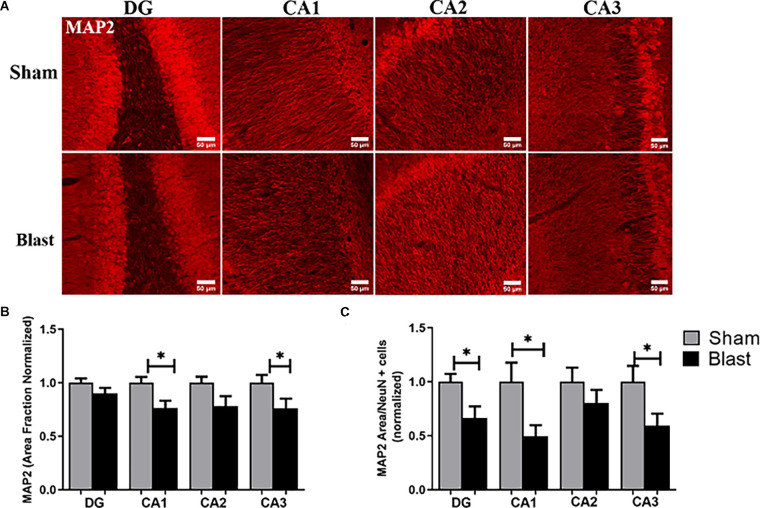
Figure 5.
Dendritic alterations depicted dysfunction in the hippocampus 52 weeks following repeated blast exposure. (A) Representative images of MAP2 in the hippocampus region of the brain. Magnification is at 20x and scale bar = 50 μm. (B) Decreases in area fraction of MAP2 were observed in the CA1 and CA3 sub-regions of the hippocampus in blast animals compared to the sham group. (C) The MAP2 area divided by the amount of NeuN+ cells within the region of interest was significantly lower in the DG, CA1, and CA3 sub-regions of the hippocampus in the blast group. *p < 0.05. Data is represented as Mean ± SEM. MAP2, Microtubule-AssociatedProteins.

