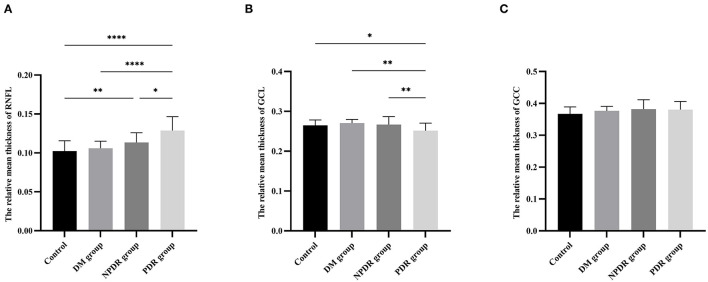
Figure 3.
Comparisons of relative mean thickness of RNFL, GCL, and GCC layers among the DM, NPDR, PDR, and normal control groups. The bar charts show the comparison results of the relative mean thickness of RNFL (A), GCL (B), GCC (C) in eyes with normal control (healthy subjects), DM (no DR), NPDR, and PDR. RNFL, retinal nerve fiber layer; GCL, ganglion cell layer; GCC, ganglion cell complex layer; DM, diabetes mellitus; DR, diabetic retinopathy; NPDR, non-proliferative diabetic retinopathy; PDR, proliferative diabetic retinopathy. * p < 0.05, ** p < 0.01, *** p < 0.001.

