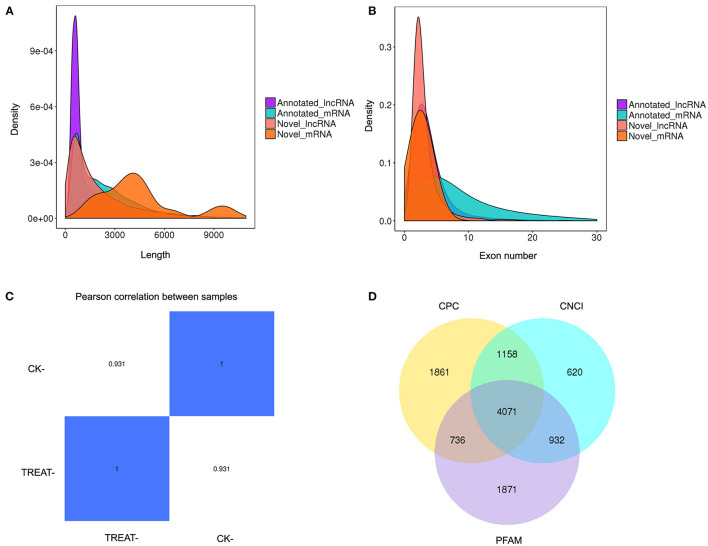
Figure 2.
Expression profiling of lncRNAs in the mouse DED model. (A) Histogram showing length distribution of novel lncRNA. (B) Histogram showing the number of lncRNA exons. (C) Heatmap of gene expression correlation; the numerical value refers to the correlation coefficient. (D) Venn diagram presenting overlapping potential lncRNAs of three computational approaches (CPC/CNCI/PFAM). DED, dry eye disease; lncRNAs, long non-coding RNAs.

