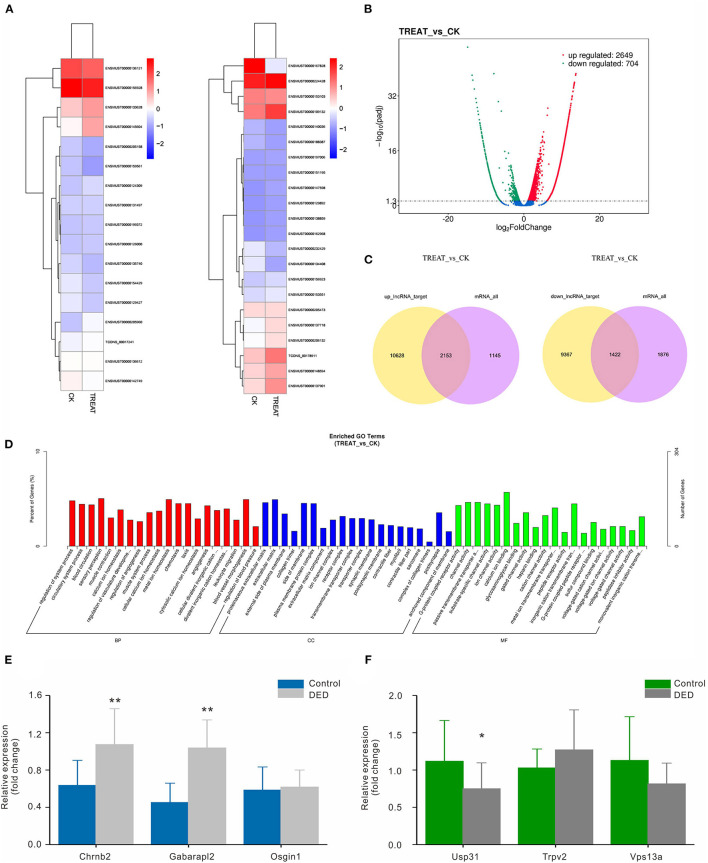
Figure 3.
Bioinformatic functional analysis of differentially expressed lncRNAs. (A) Heatmap of expression levels of tissue-specific lncRNAs. (B) Volcano plot of the different lncRNAs expression in each group. (C) Venn diagram showing co-location or co-expression of lncRNA-target genes (mRNAs). (D) The number of differentially expressed lncRNAs in BP, CC, and MF. (E) Expression levels of the top three upregulated lncRNAs in both groups via RT-qPCR. (F) Expression levels of the top three downregulated lncRNAs in both groups via RT-qPCR. CC, cellular component; MF, molecular function; BP, biological process. *p < 0.05, **p < 0.01. DED, dry eye disease.

