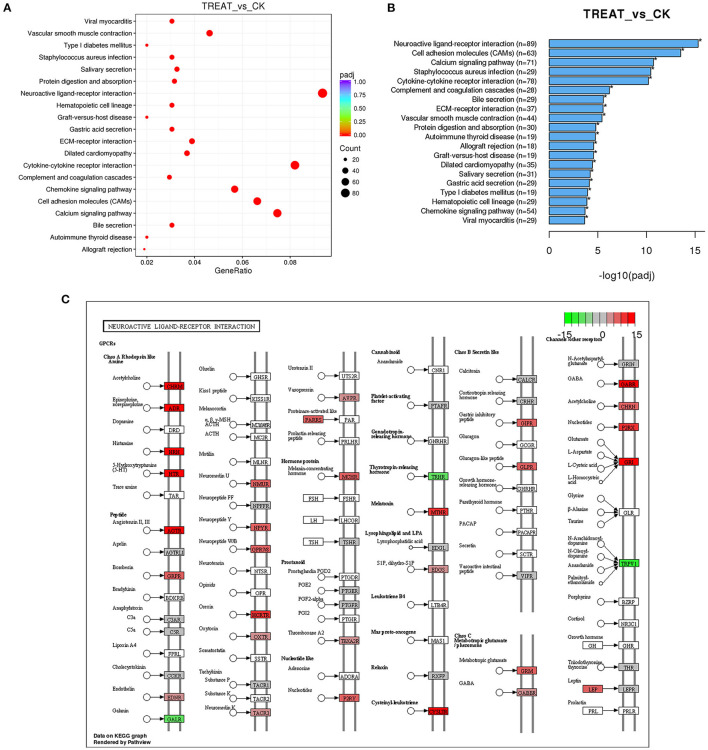
Figure 4.
Signaling pathway analysis of differentially expressed lncRNAs. (A) The KEGG pathway analysis demonstrates that the genes are enriched in multiple pathways. (B) Lists of the most affected pathways. (C) Neuroactive ligand–receptor interaction signaling pathway map. Red in (C) indicates upregulated genes; green in (C) indicates downregulated genes; lncRNAs, long non-coding RNAs; KEGG, Kyoto Encyclopedia of Genes and Genomes.

