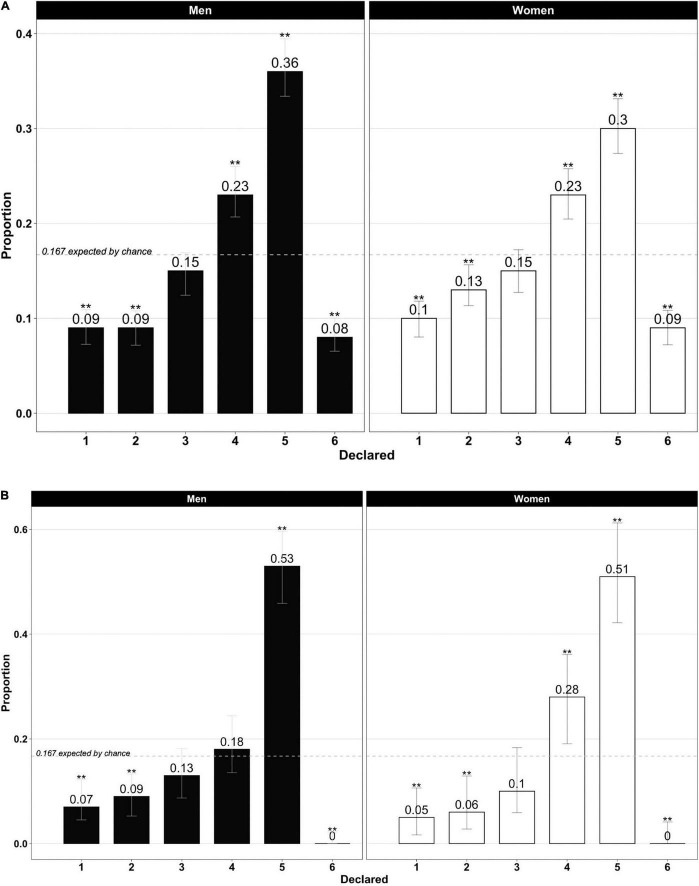
FIGURE 1.
(A) Declared die outcome (men vs. women). Proportion test confidence interval at 95% is represented in gray. Asterisks above the confidence interval mean significant differences between the observed and expected distribution by chance. **p < 0.01; *p < 0.05. (B) Declared die outcome (men vs. women in excluded participants). Proportion test confidence interval at 95% is represented in gray. Asterisks above the confidence interval mean significant differences between the observed and expected distribution by chance. **p < 0.01; *p < 0.05.

