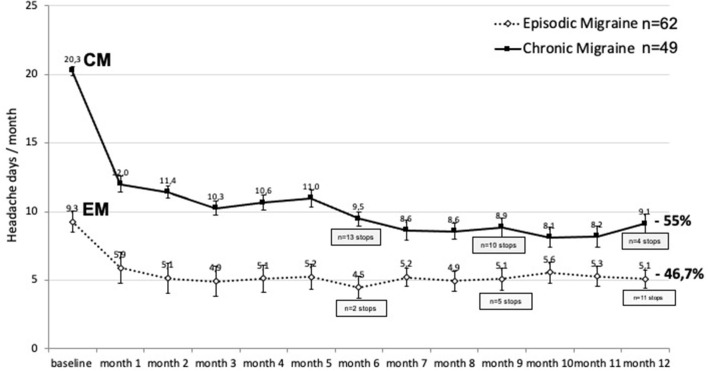
Figure 6.
Monthly headache days during 12 months of erenumab treatment (mean ± SEM) and their percentage decrease during 12 months compared to the pretreatment month in EM (dashed line) and CM (continuous line). The number of patients who stopped treatment because of inefficacy or adverse effects is shown at 6, 9, and 12 months. p < 0.0001 vs. baseline at all the timepoints; p < 0.05 between EM and CM.

